GUANACO Interface
Anndata Visualization
Data Overview
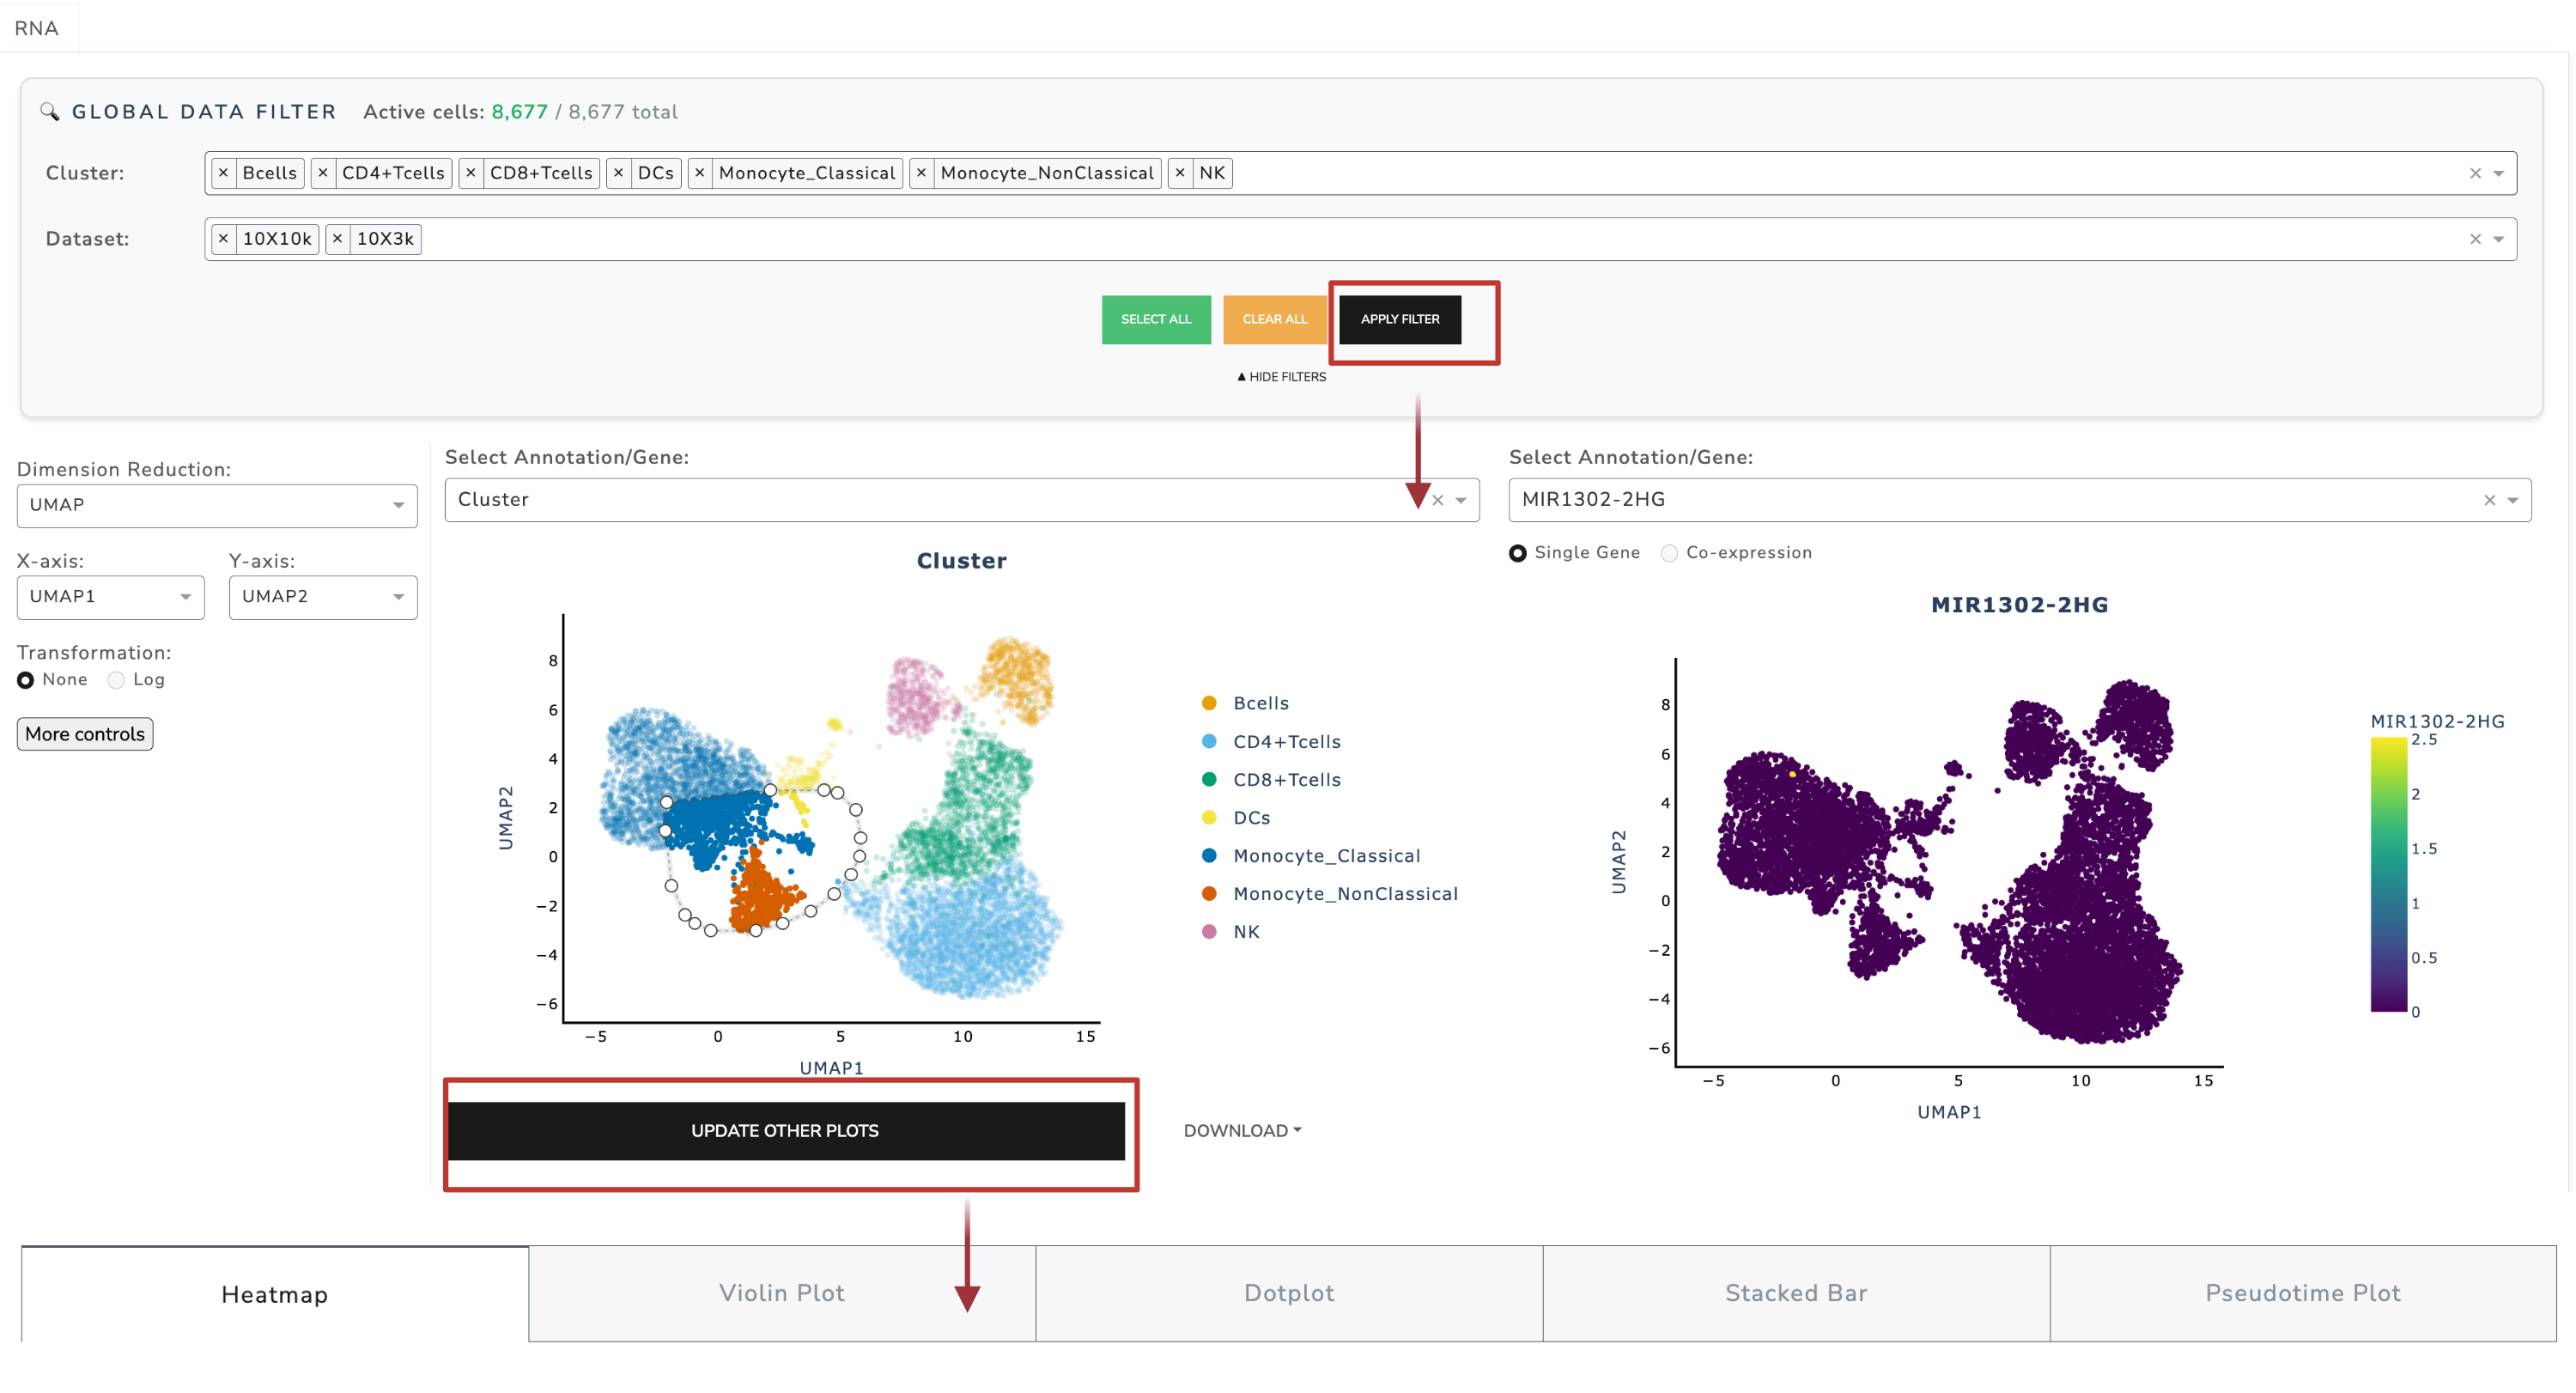
When the interface is opened, the default displays the Description panel and a side-by-side dimensional reduction view. Each embedding can be colored by metadata or by gene expression (selected from the dropdown). The image below highlights how to quickly explore the dataset to capture most of the key information.
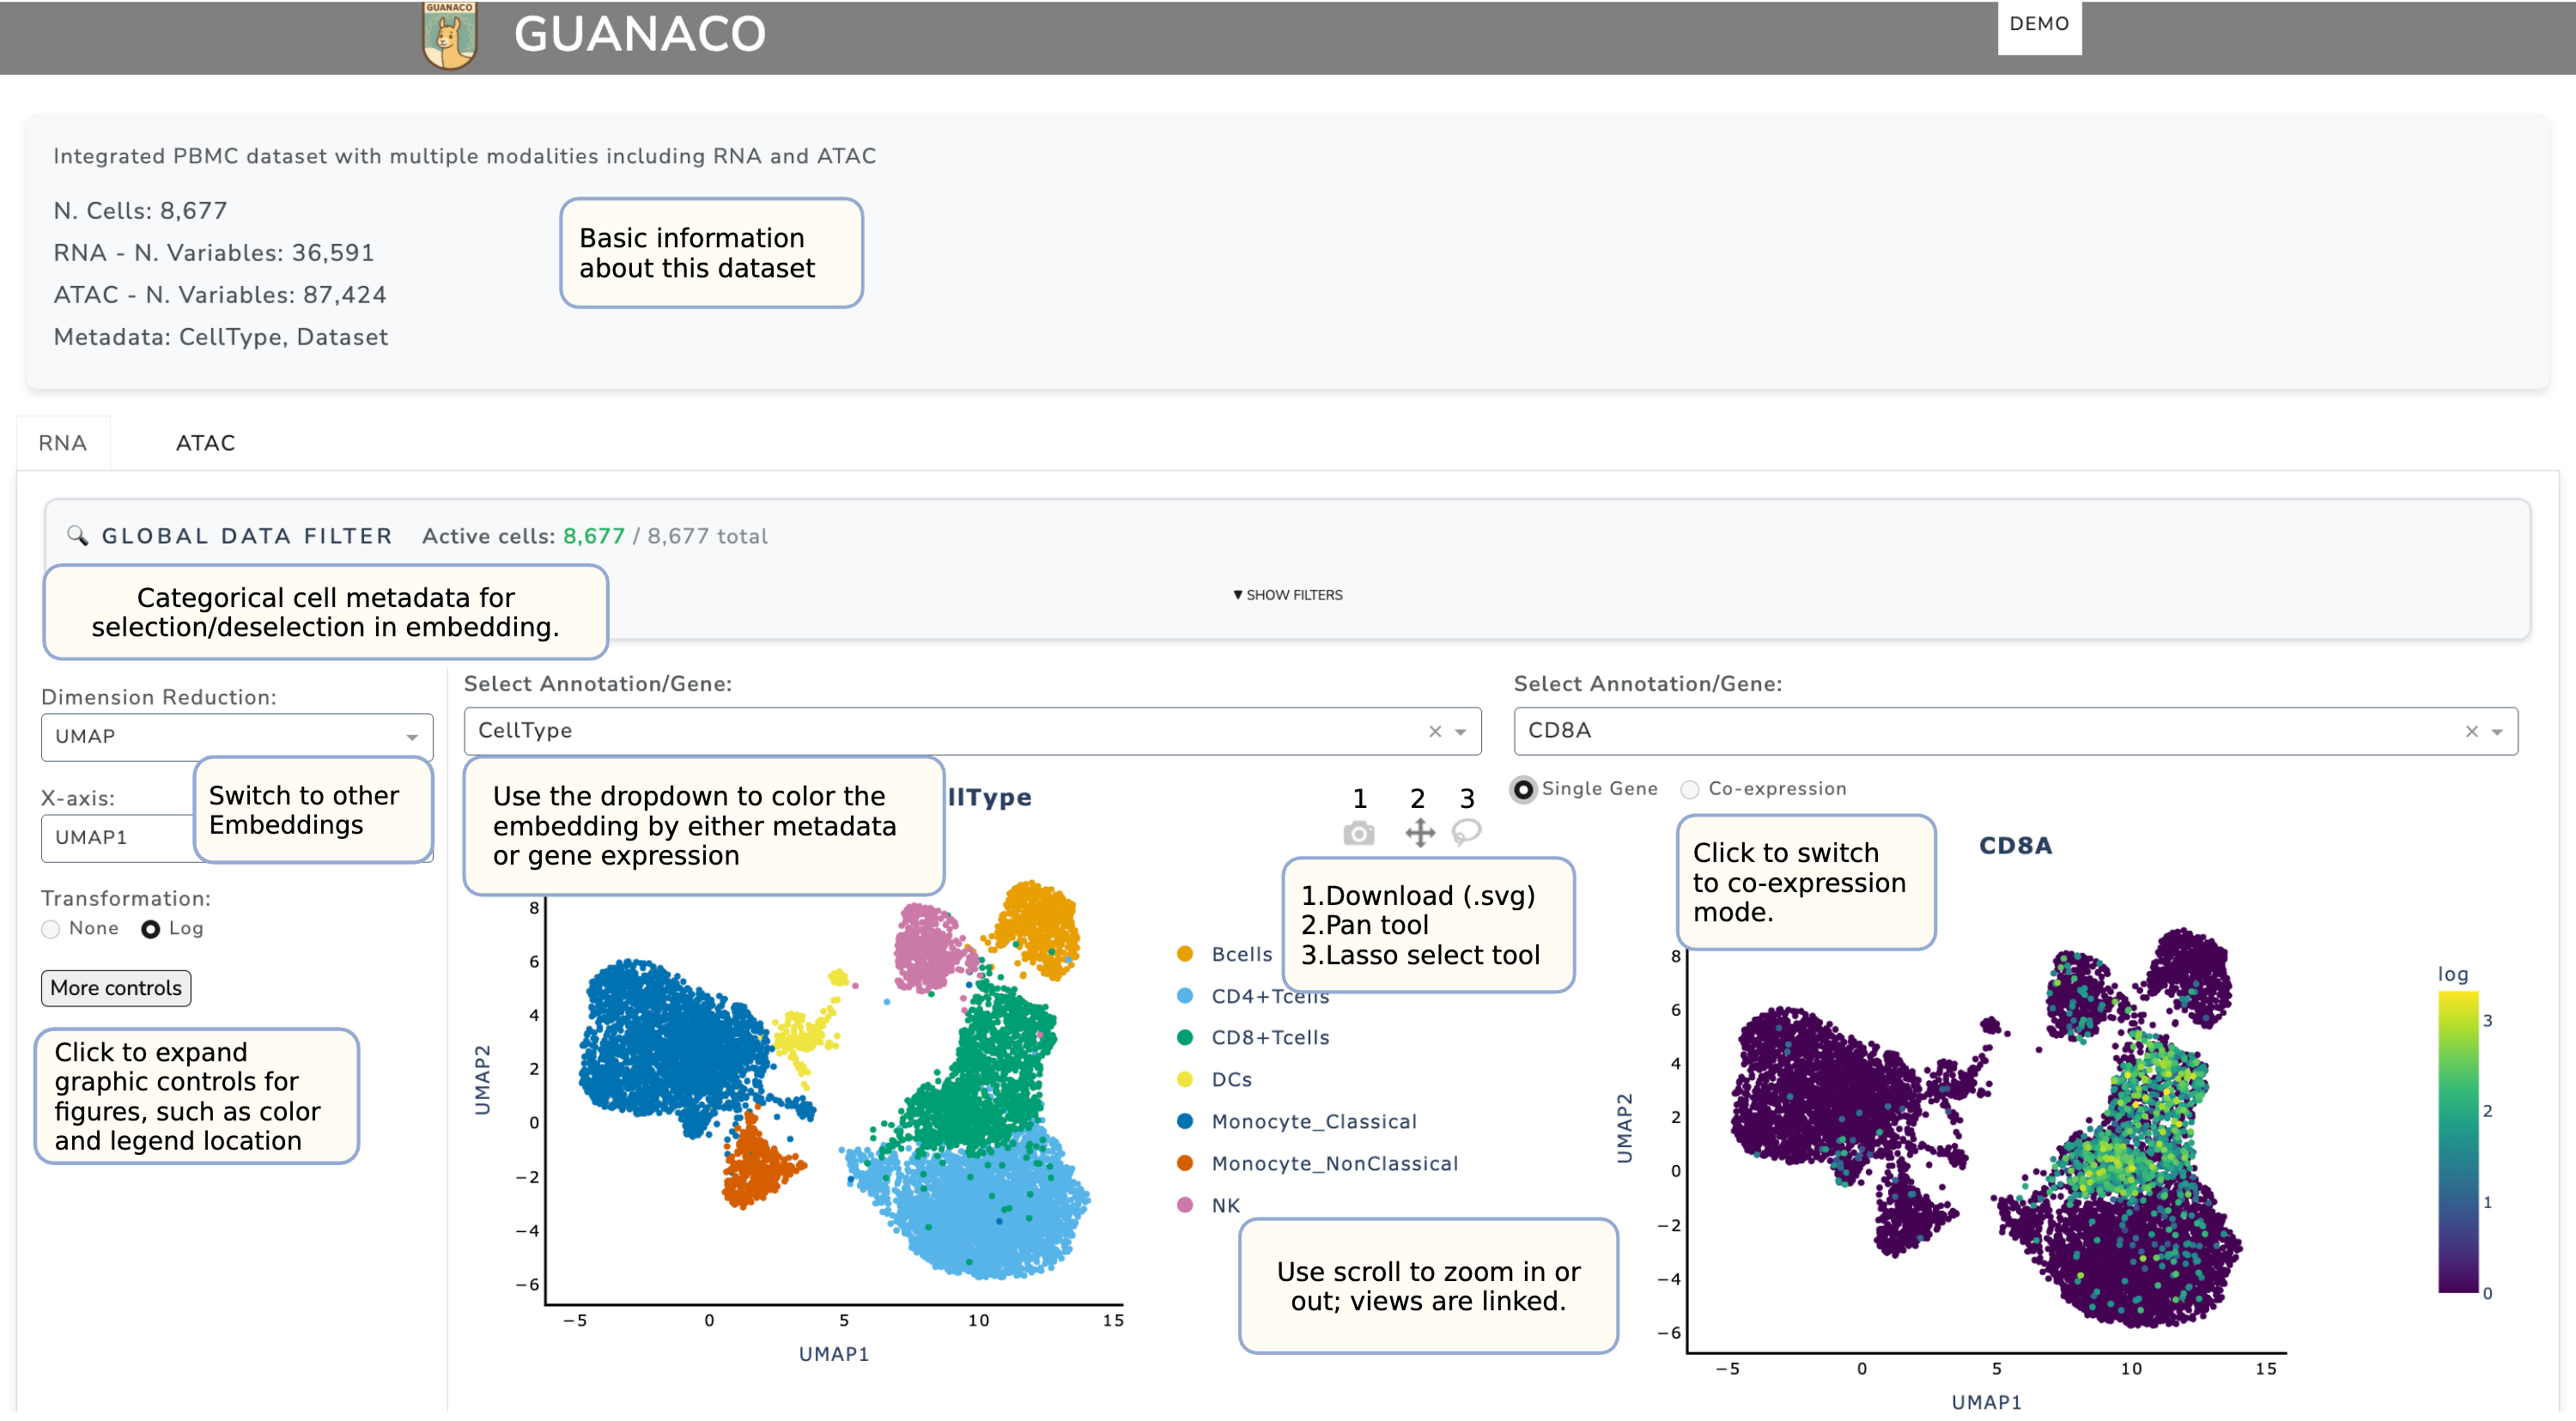
Data Selection: Use the Global Data Filter to select or deselect cells displayed in the embedding by categorical metadata. All embeddings stored in .obsm will be available in the Dimensional Reduction panel. For dimensional reduction methods with more than two axes, you may select at most two for display (X-axis and Y-axis).
Navigation and Tools:
Zooming: Use the scroll wheel to zoom in and out. The two embeddings are linked, ensuring synchronized navigation.
Toolbar icons (top-right): - Camera: Download the current view as .svg. - Pan tool (middle icon): Hold the space bar and drag to move the
view; double-click to reset to default.
Lasso tool: Select cells in the left embedding and pass them to other plots (see Cell Selection section).
Marker Genes Visualization
Heatmap
GUANACO provides single-cell level heatmaps supporting up to 50k cells. The order of Cells (columns) and genes (rows) are controlled from the left panel. If the dataset exceeds this limit, cells are automatically binned. Three transformation options are available: none, log, and z-score. For z-score, the top 99th percentile is used for better visualization.
Heatmaps support up to two annotations; one may be continuous (e.g., pseudotime). By default, cells are clustered first by the primary annotation and then by the secondary. If the secondary annotation is continuous, ordering is prioritized by the continuous variable.
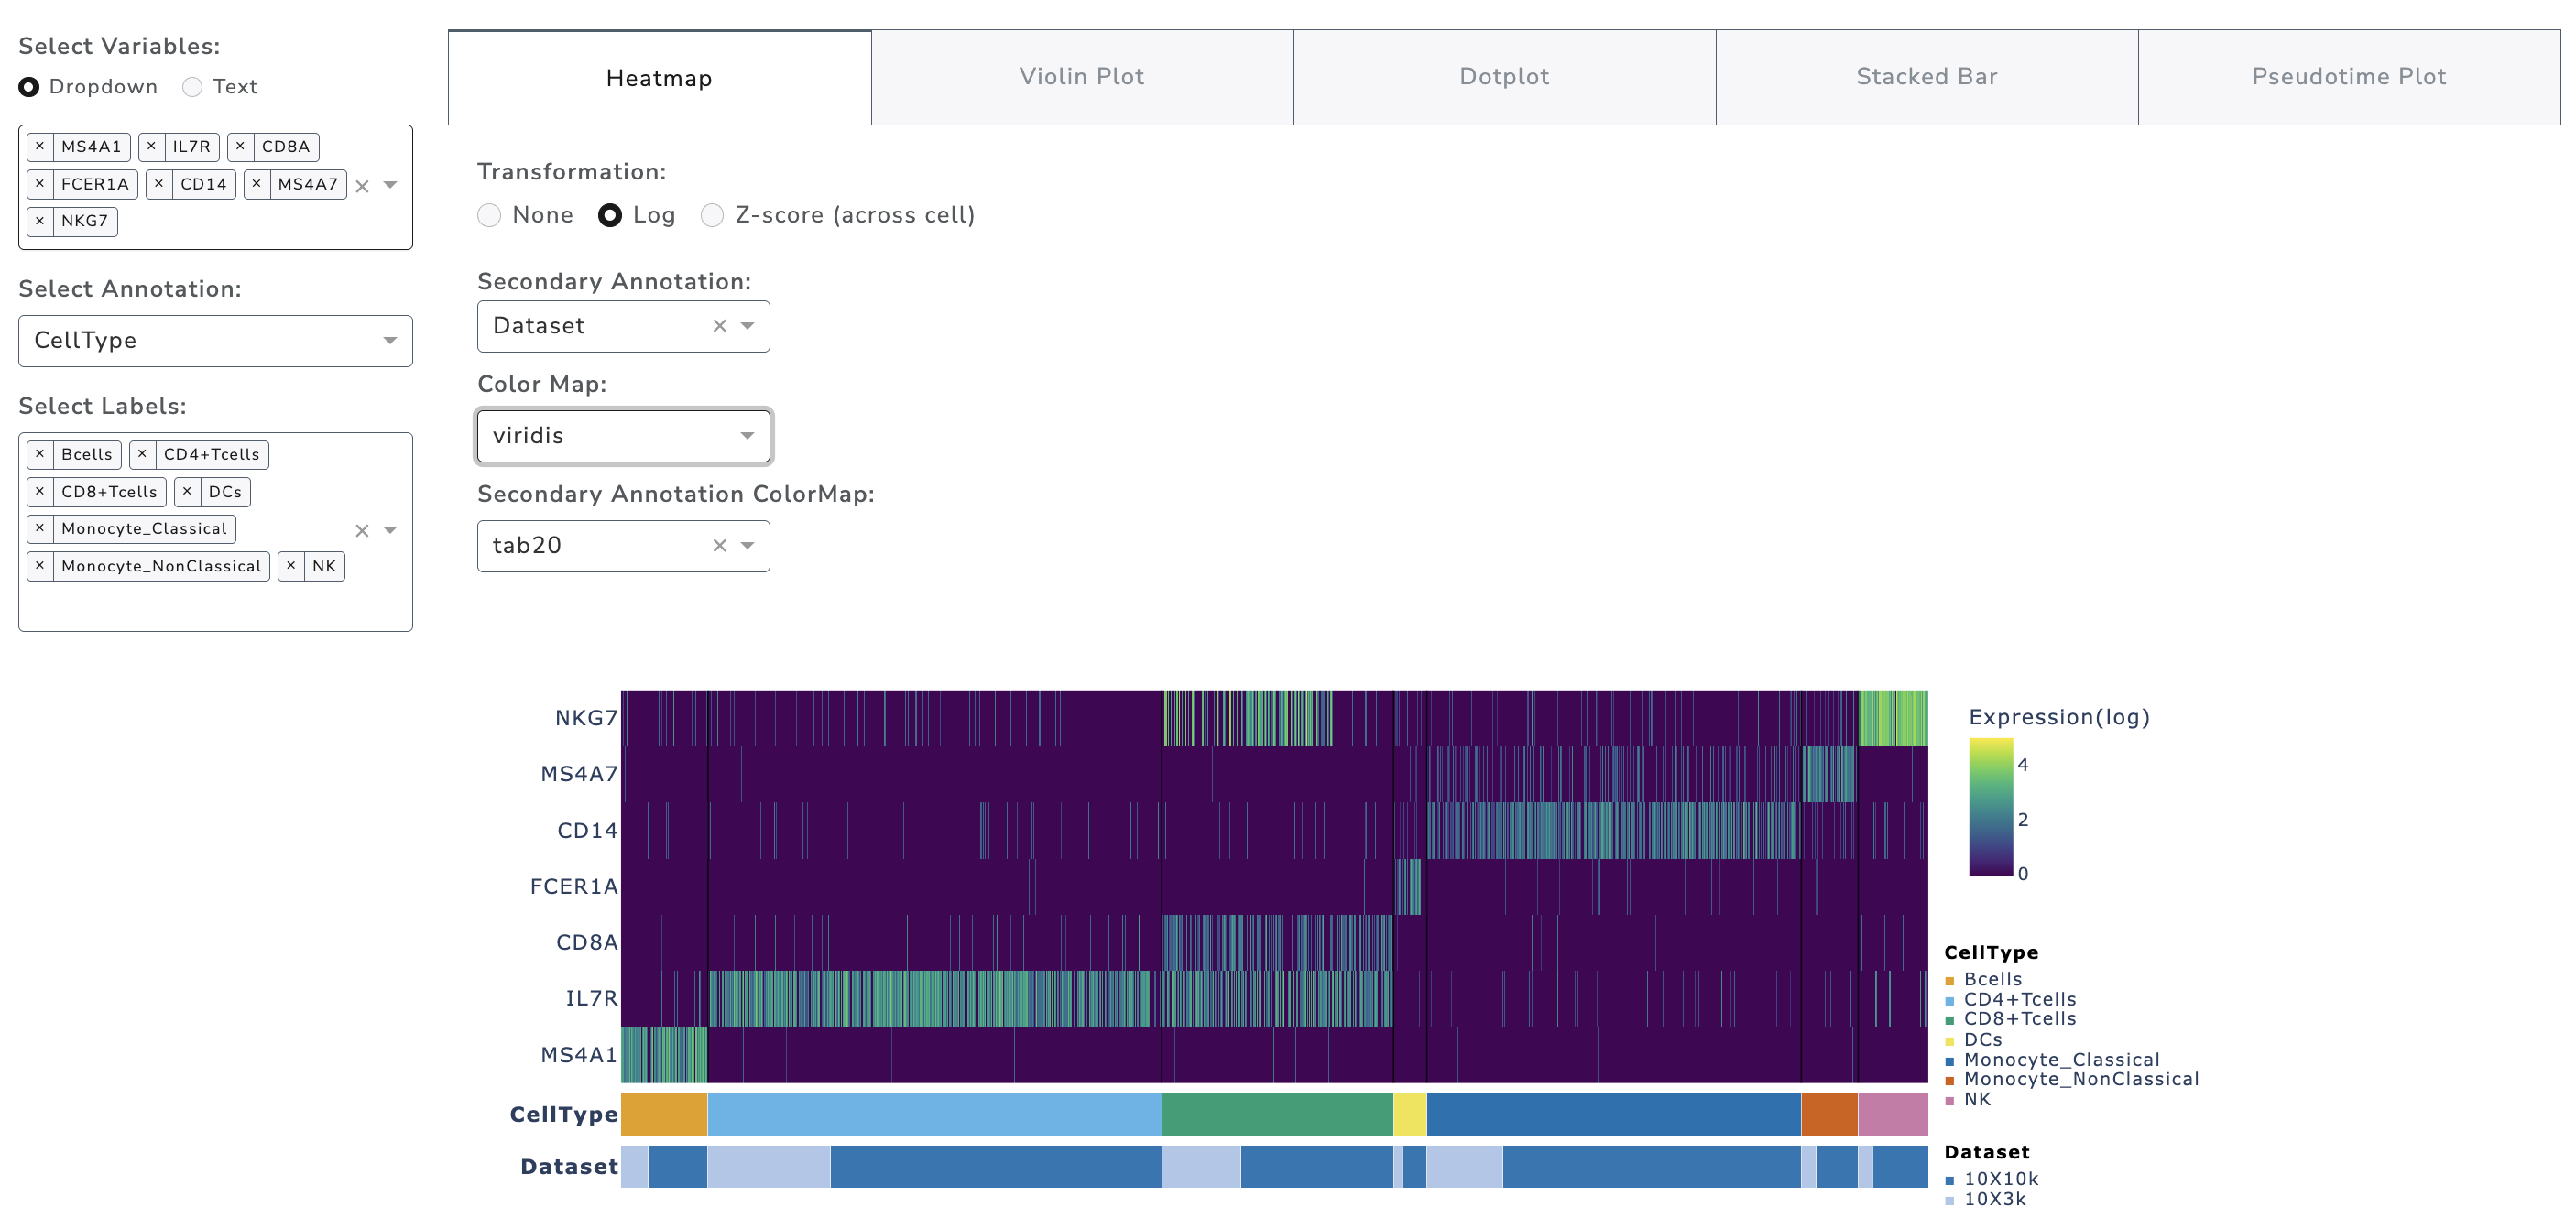
Color settings: - The discrete colormap for the first annotation matches the embedding section. - The colormap for the secondary annotation can be chosen via dropdown. - A library of 96 continuous colormaps is provided.
Sequential colormaps are recommended for raw and log data.
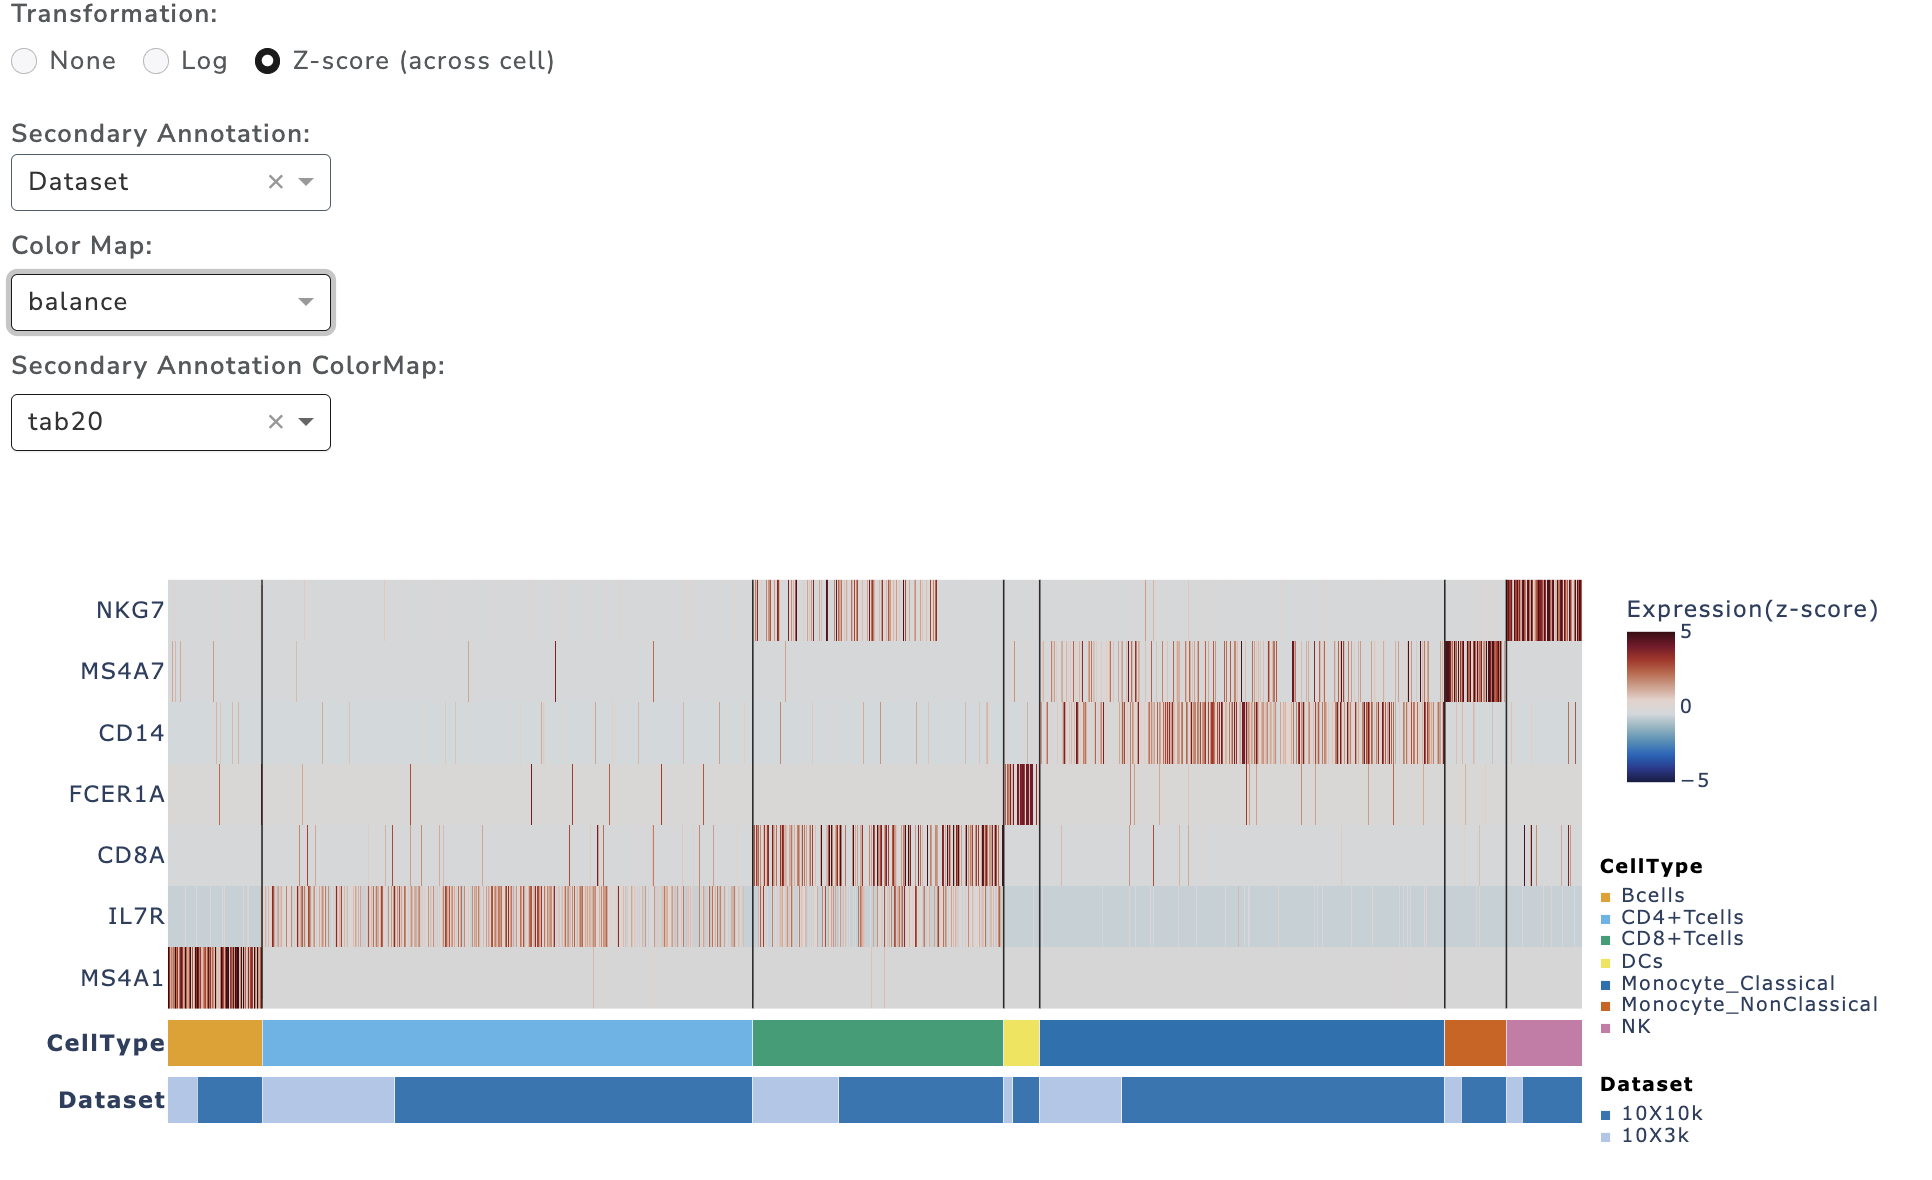
Diverging colormaps are recommended for z-score to highlight differences.(see example below)
Violin Plot
GUANACO offers two violin plot types: stacked (for multiple markers) and split/grouped (for group comparisons).
Stacked violin plot is controlled by left panel options, same as heatmap and other plots in the tab.
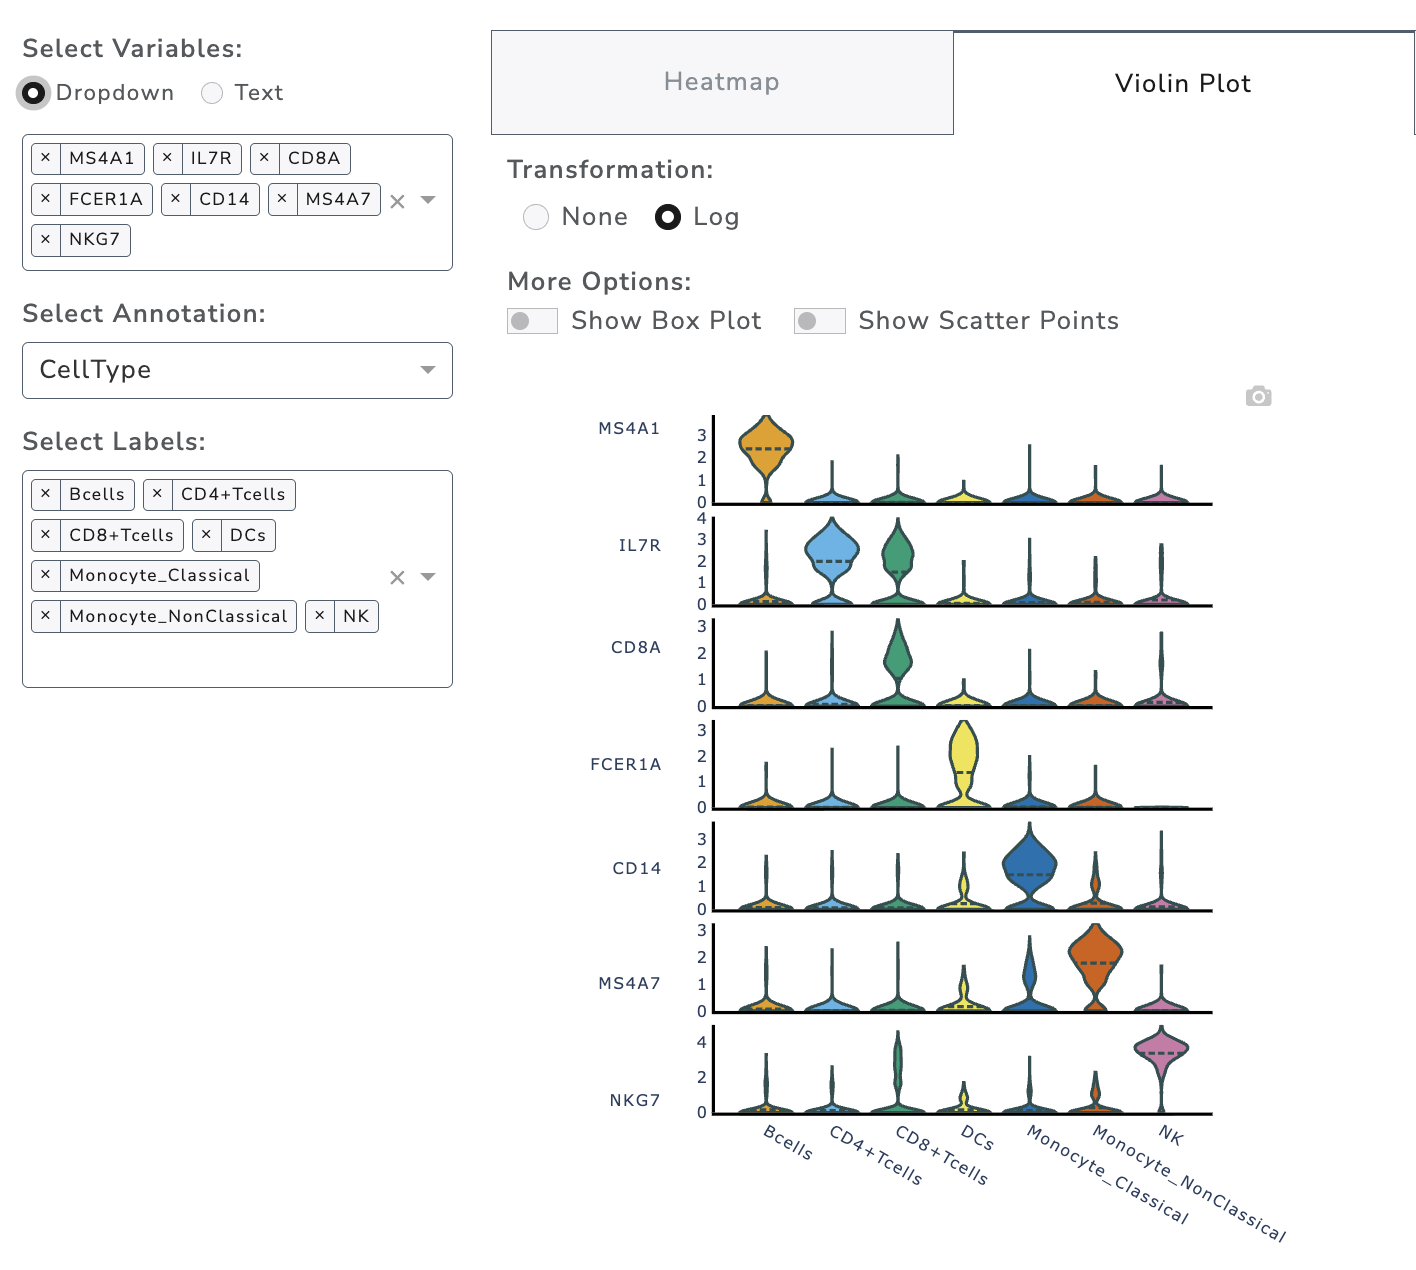
Colors are consistent with the embedding plots. Options include adding a box plot inside the violin and/or scatter dots alongside. Note that showing all scatter points may be slow for large datasets or multiple genes.
Split/grouped violin plots is a separated section that has its own gene, metadata selection panel. It allows clear group comparisons. Four analysis modes are supported:
Mode 1: Single metadata grouping - Two groups → Mann–Whitney U test and t-test - More than two groups → Kruskal–Wallis (KW) test and ANOVA
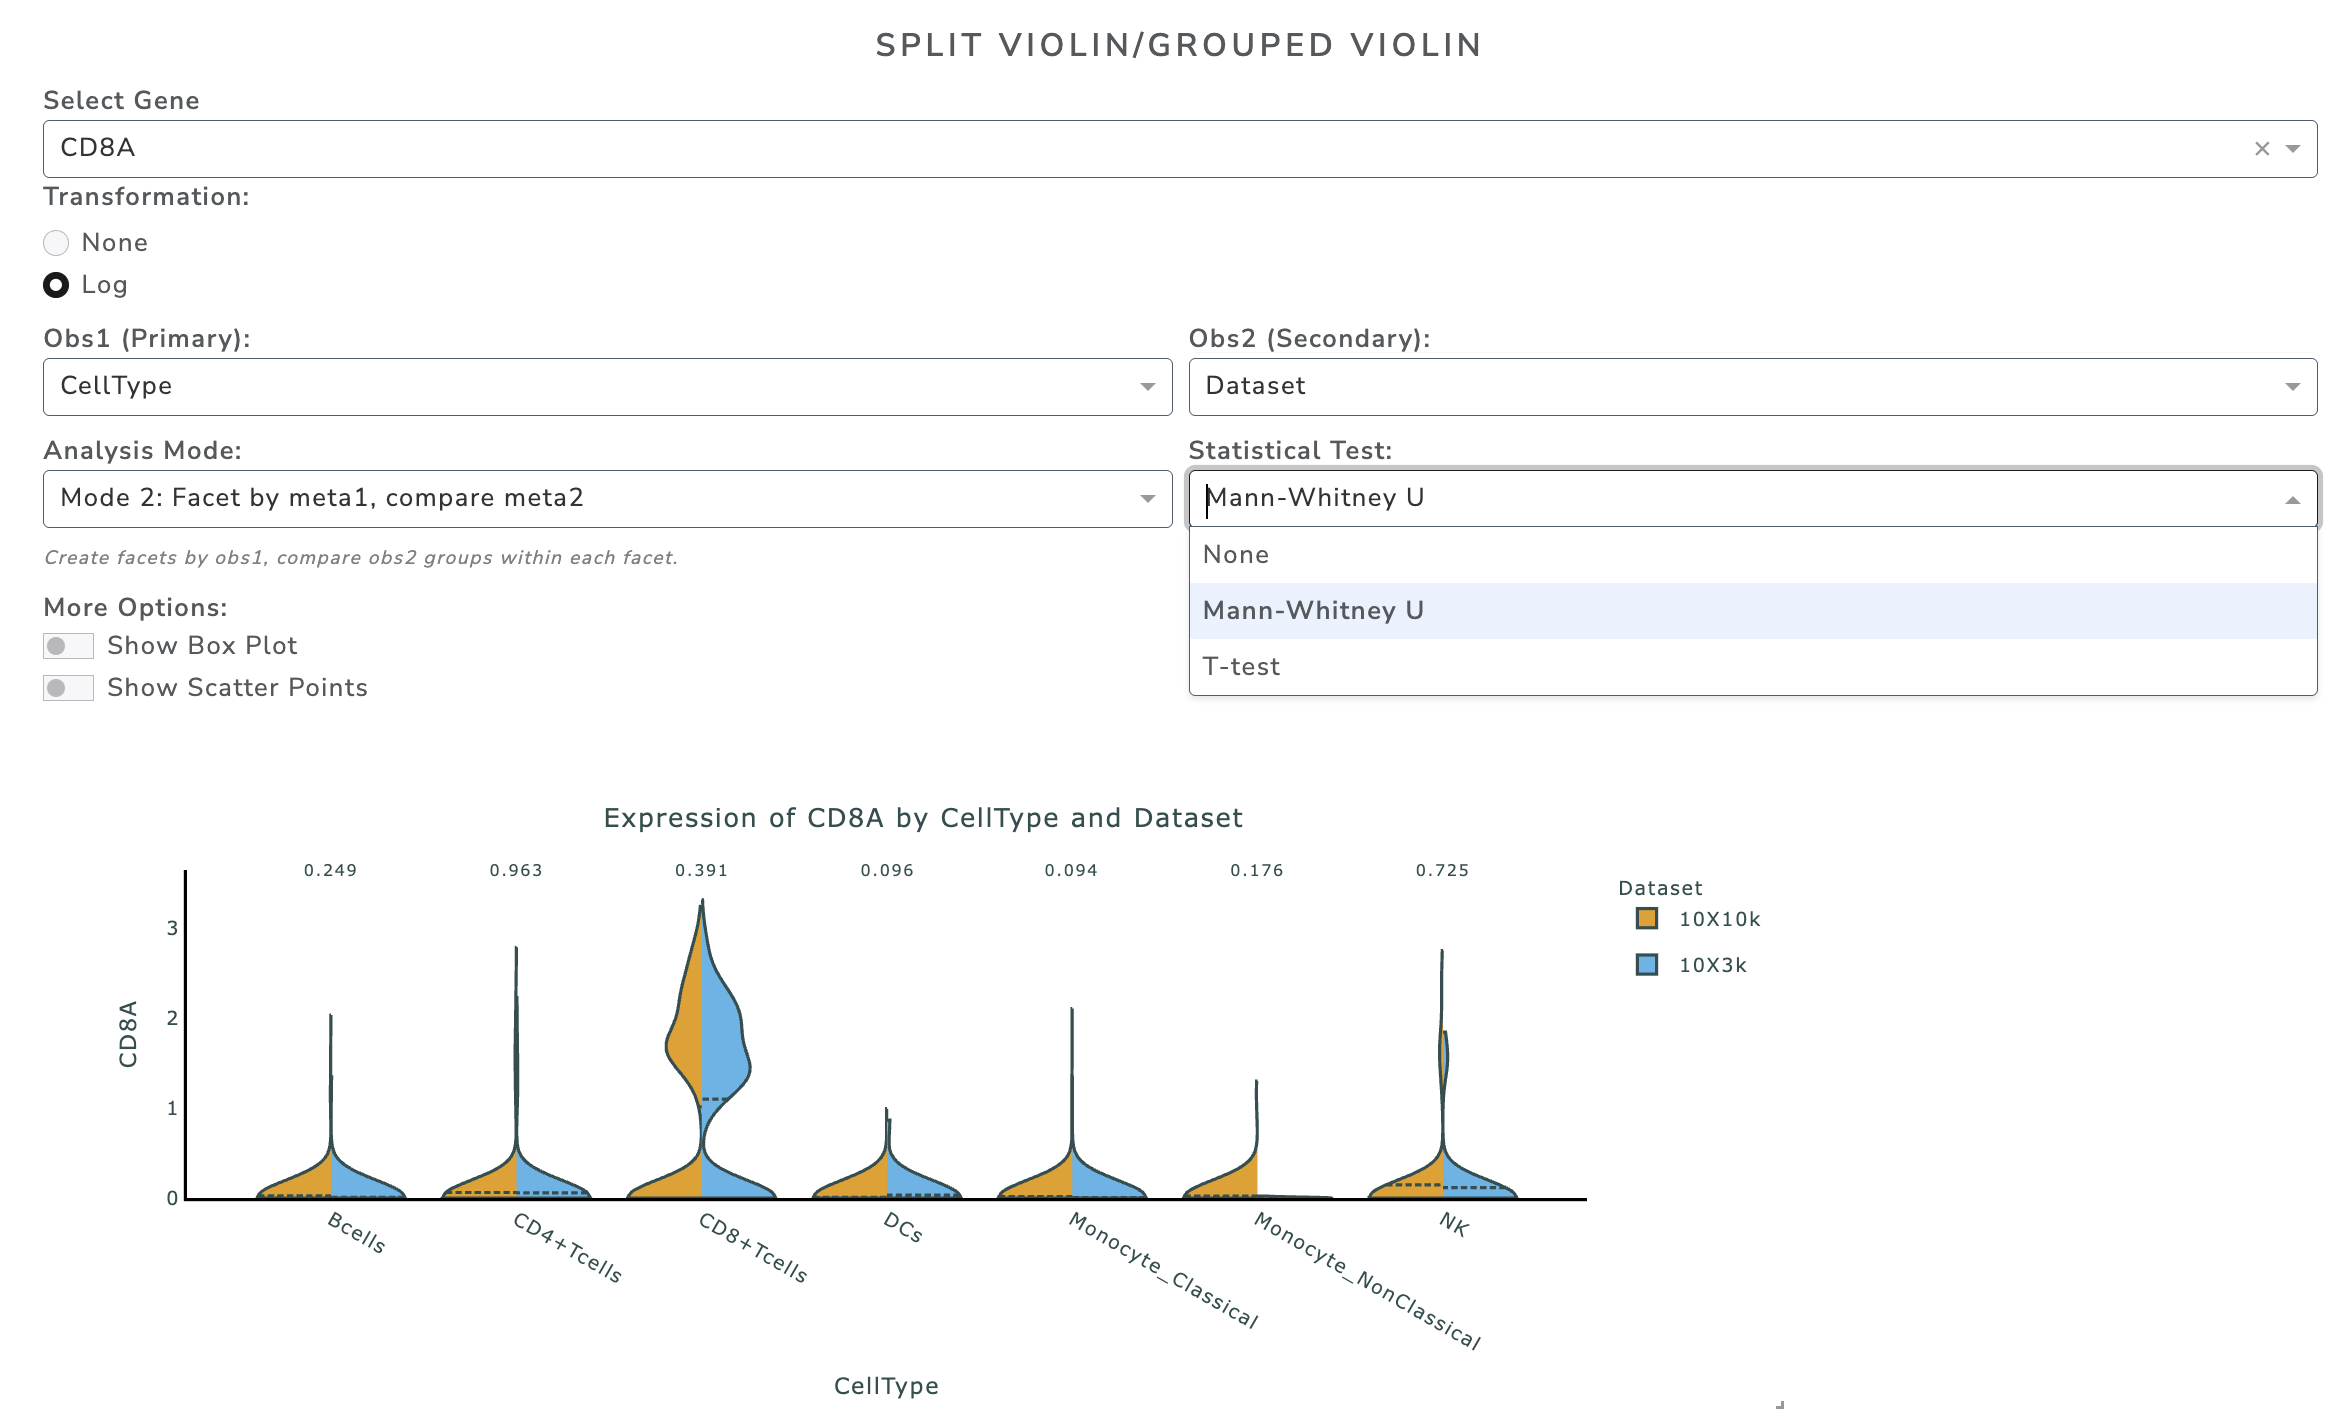
Mode 2: Facet by first metadata, compare second metadata - Two groups → Mann–Whitney U test and t-test (split violin view) - More than two groups → KW test and ANOVA (grouped violin view)
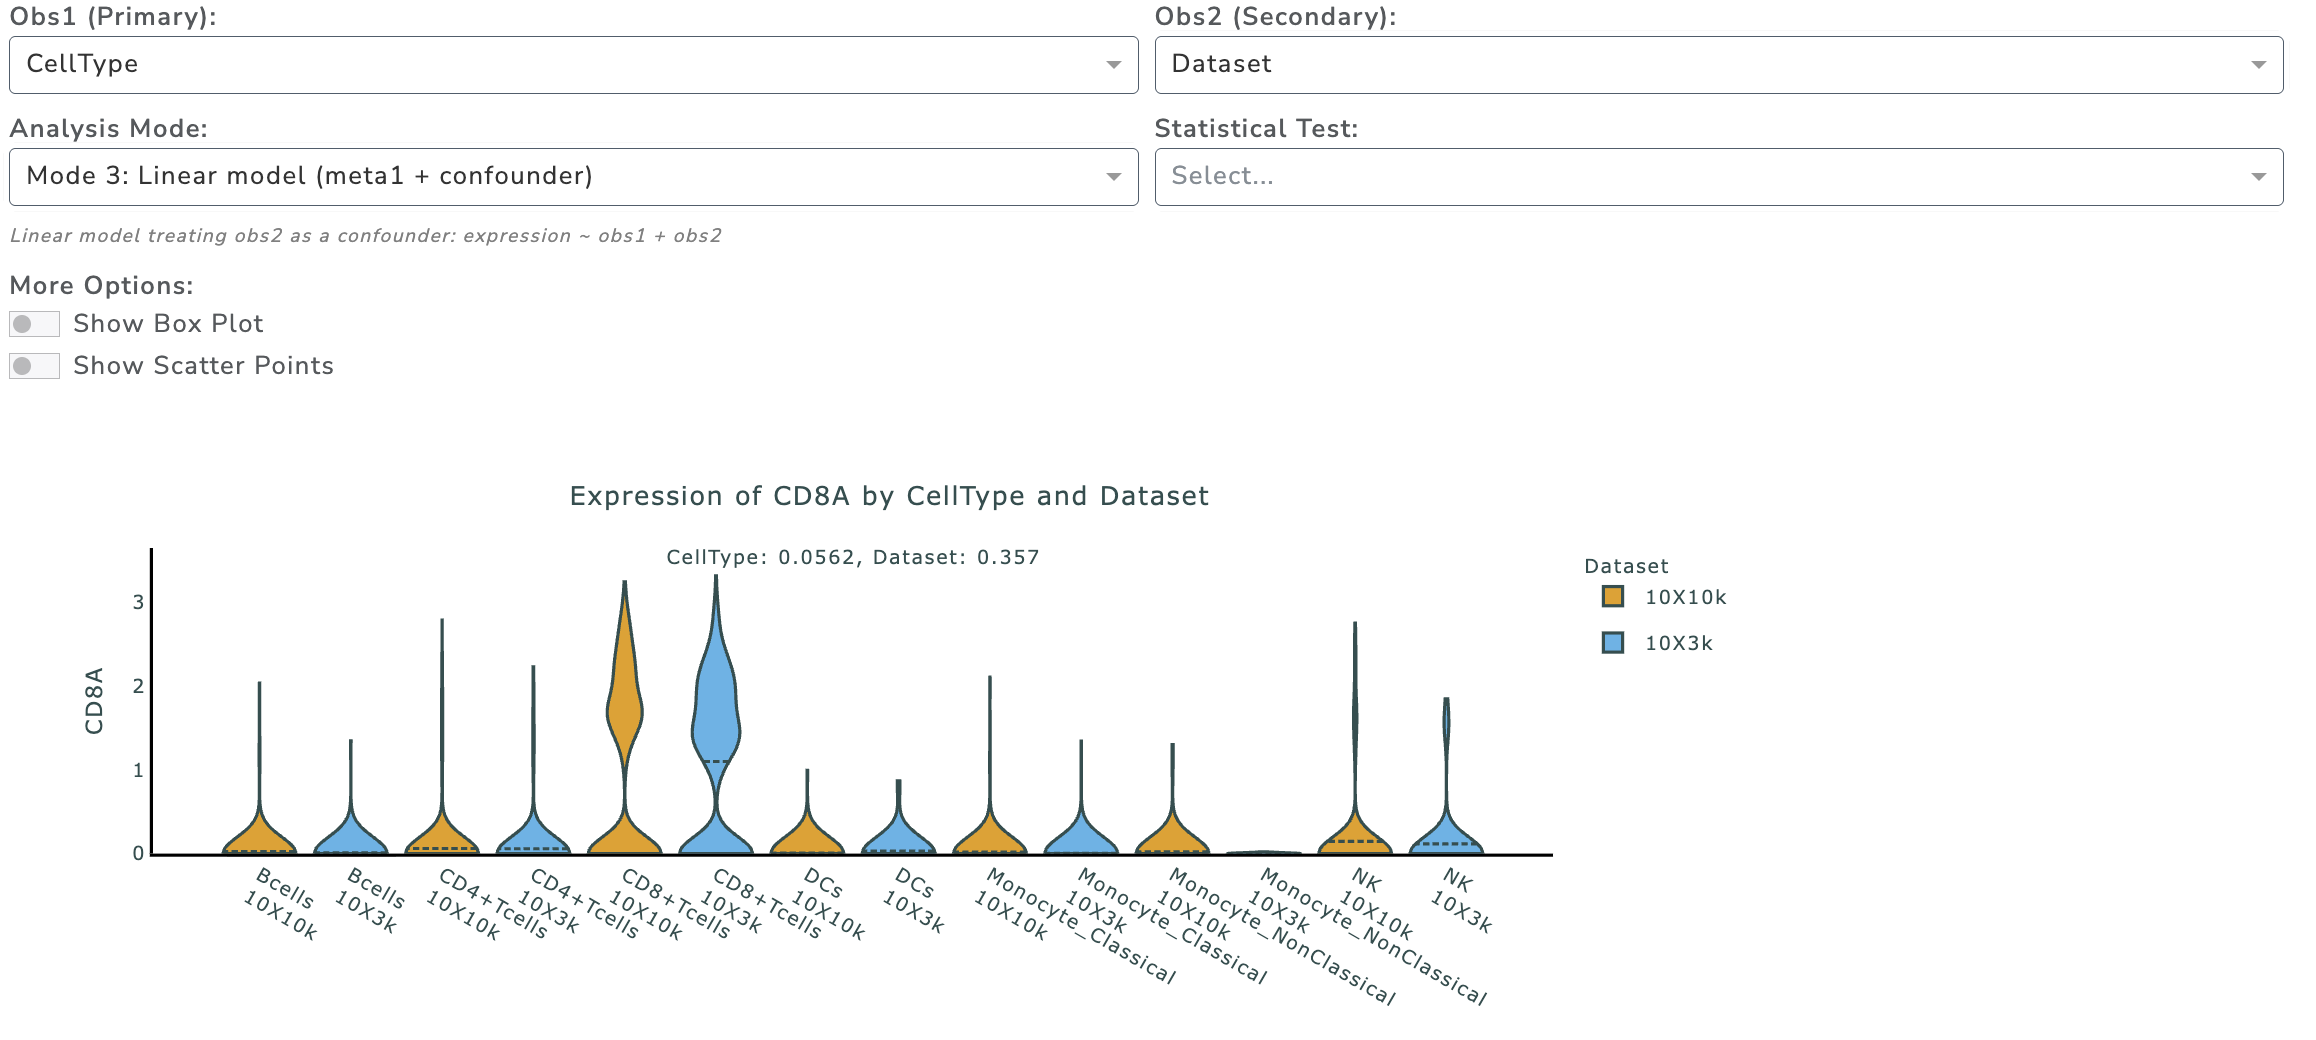
Mode 3: Linear model - Adjusts for a confounder: expression ~ obs1 + obs2 - Useful for non-nested metadata (e.g., treatment and gender)
Mode 4: Mixed model - Treats obs2 as a random effect: expression ~ meta1 + (1|obs2) - Suitable for hierarchical structures (e.g., patient nested withincondition)
Example Mode 2:
Question: For each cell type, is there a difference in expression between conditions?
Example Mode 3:
Question: Which metadata contributes more to group differences?
Dot Plot
Dot plots summarize aggregated expression across groups and are useful for displaying marker gene expression. GUANACO provides two plot types:
Dot plot
Matrix plot (pseudo-bulk heatmap)
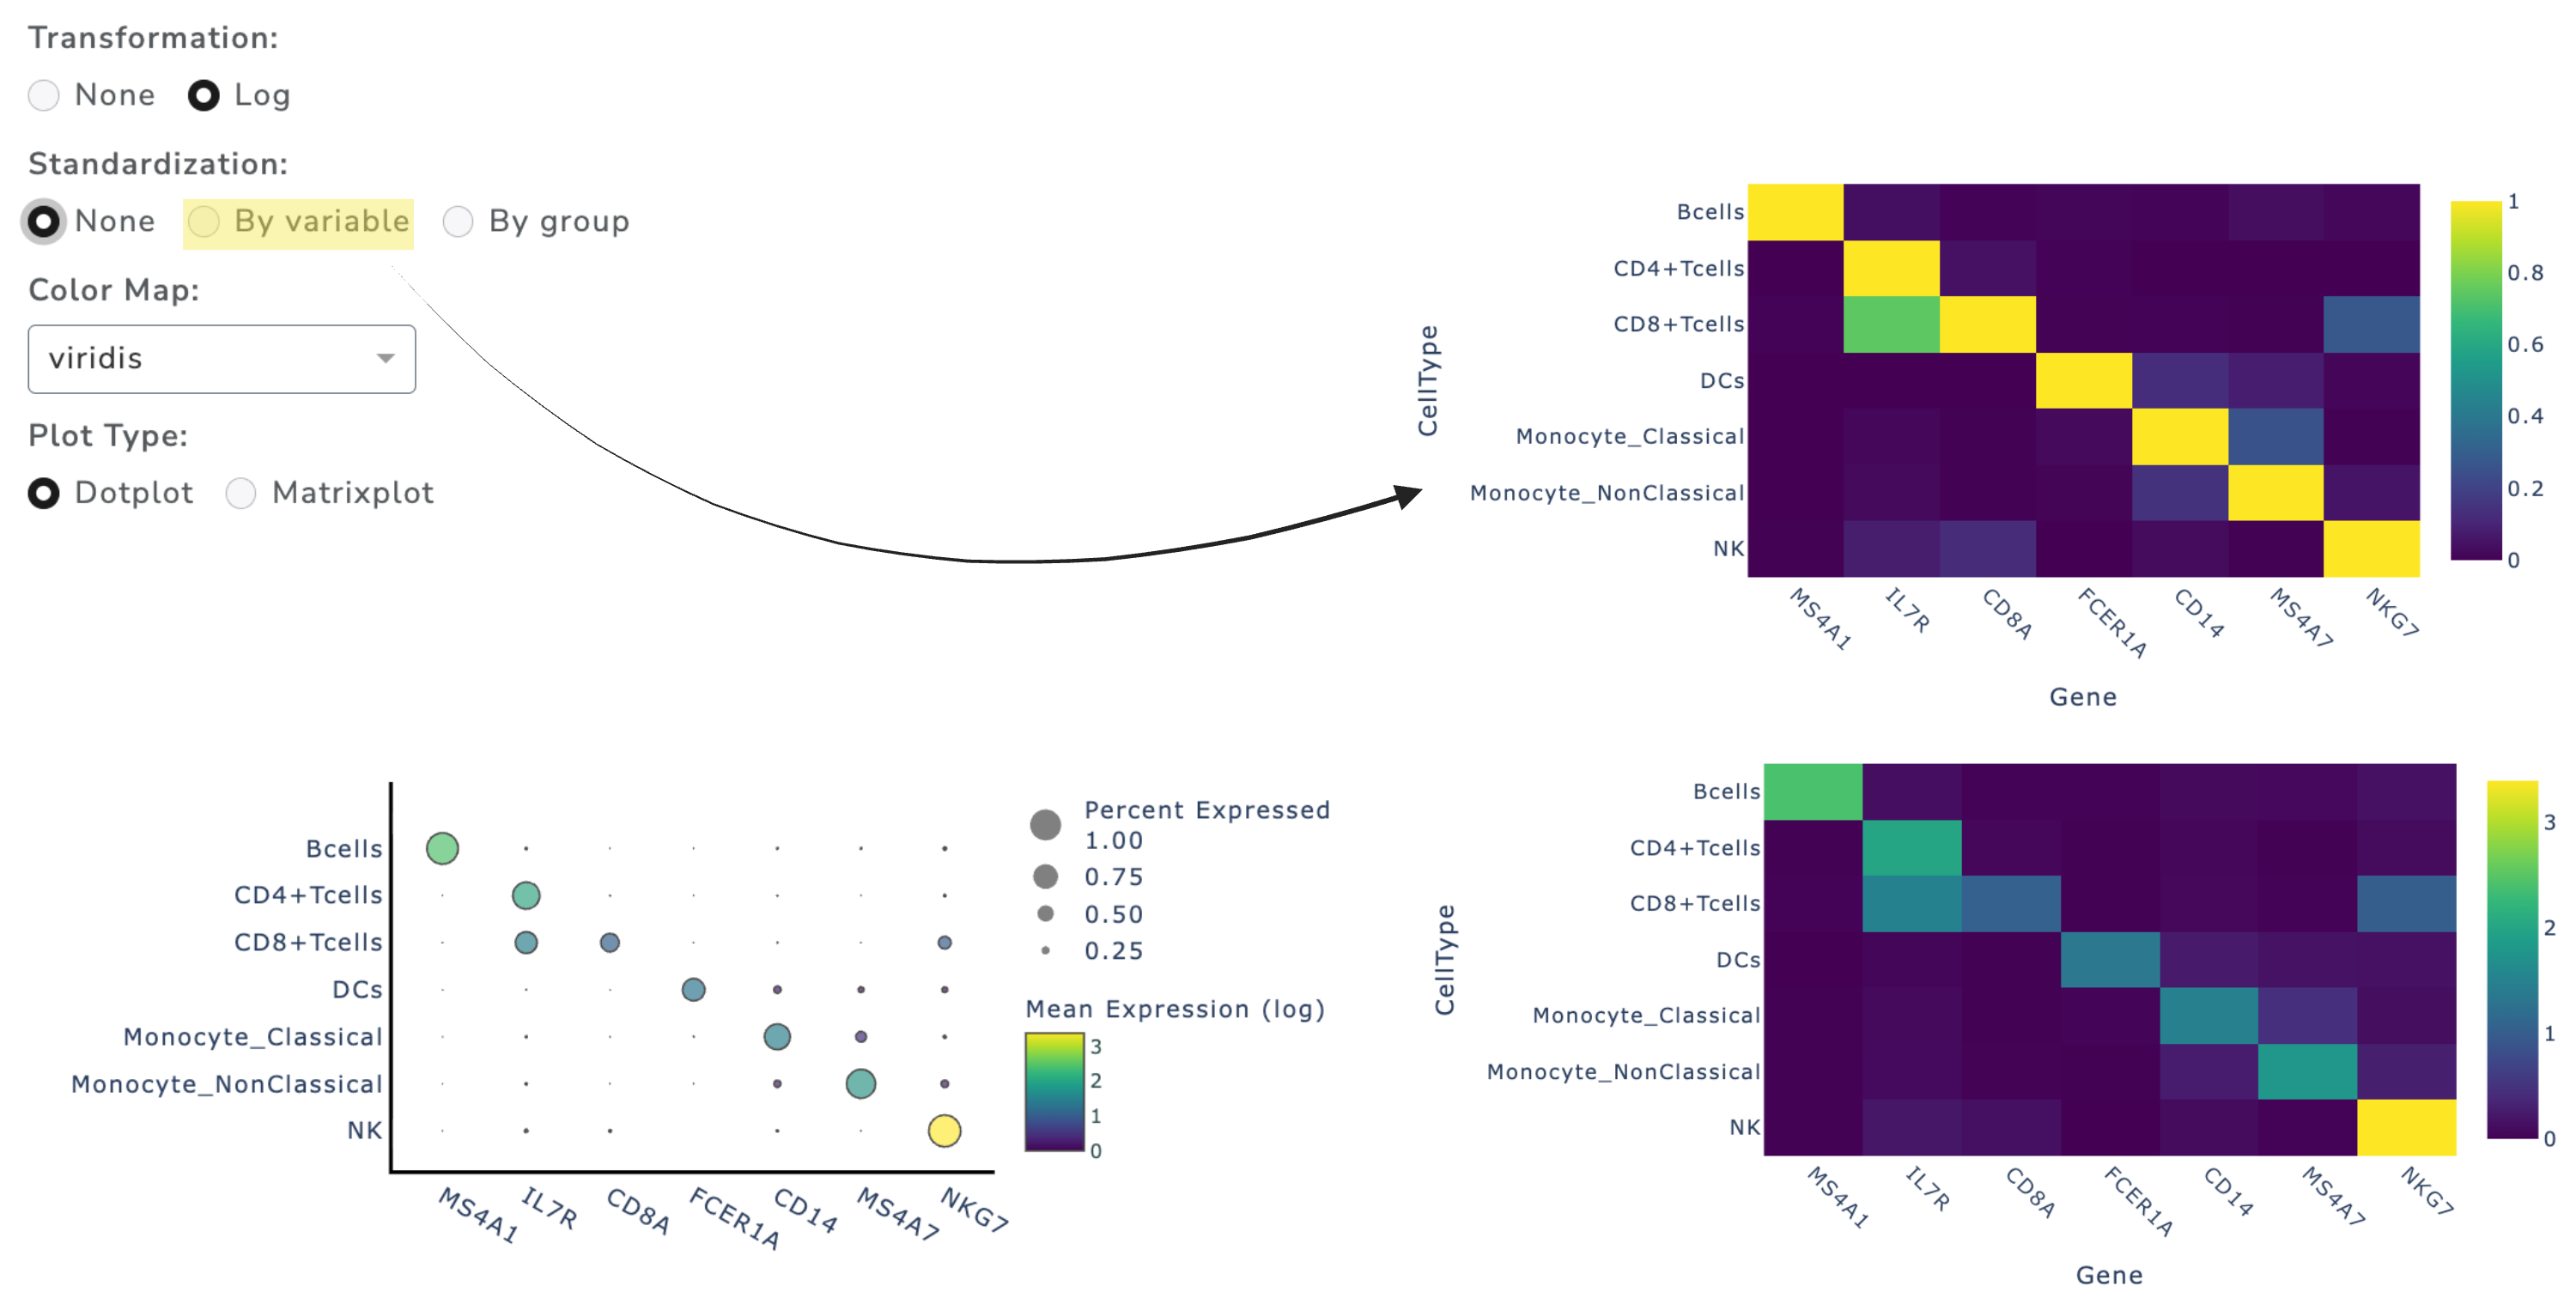
Standardization (0–1 scaling) is available to make genes directly comparable across plots.
Stacked Bar Plot
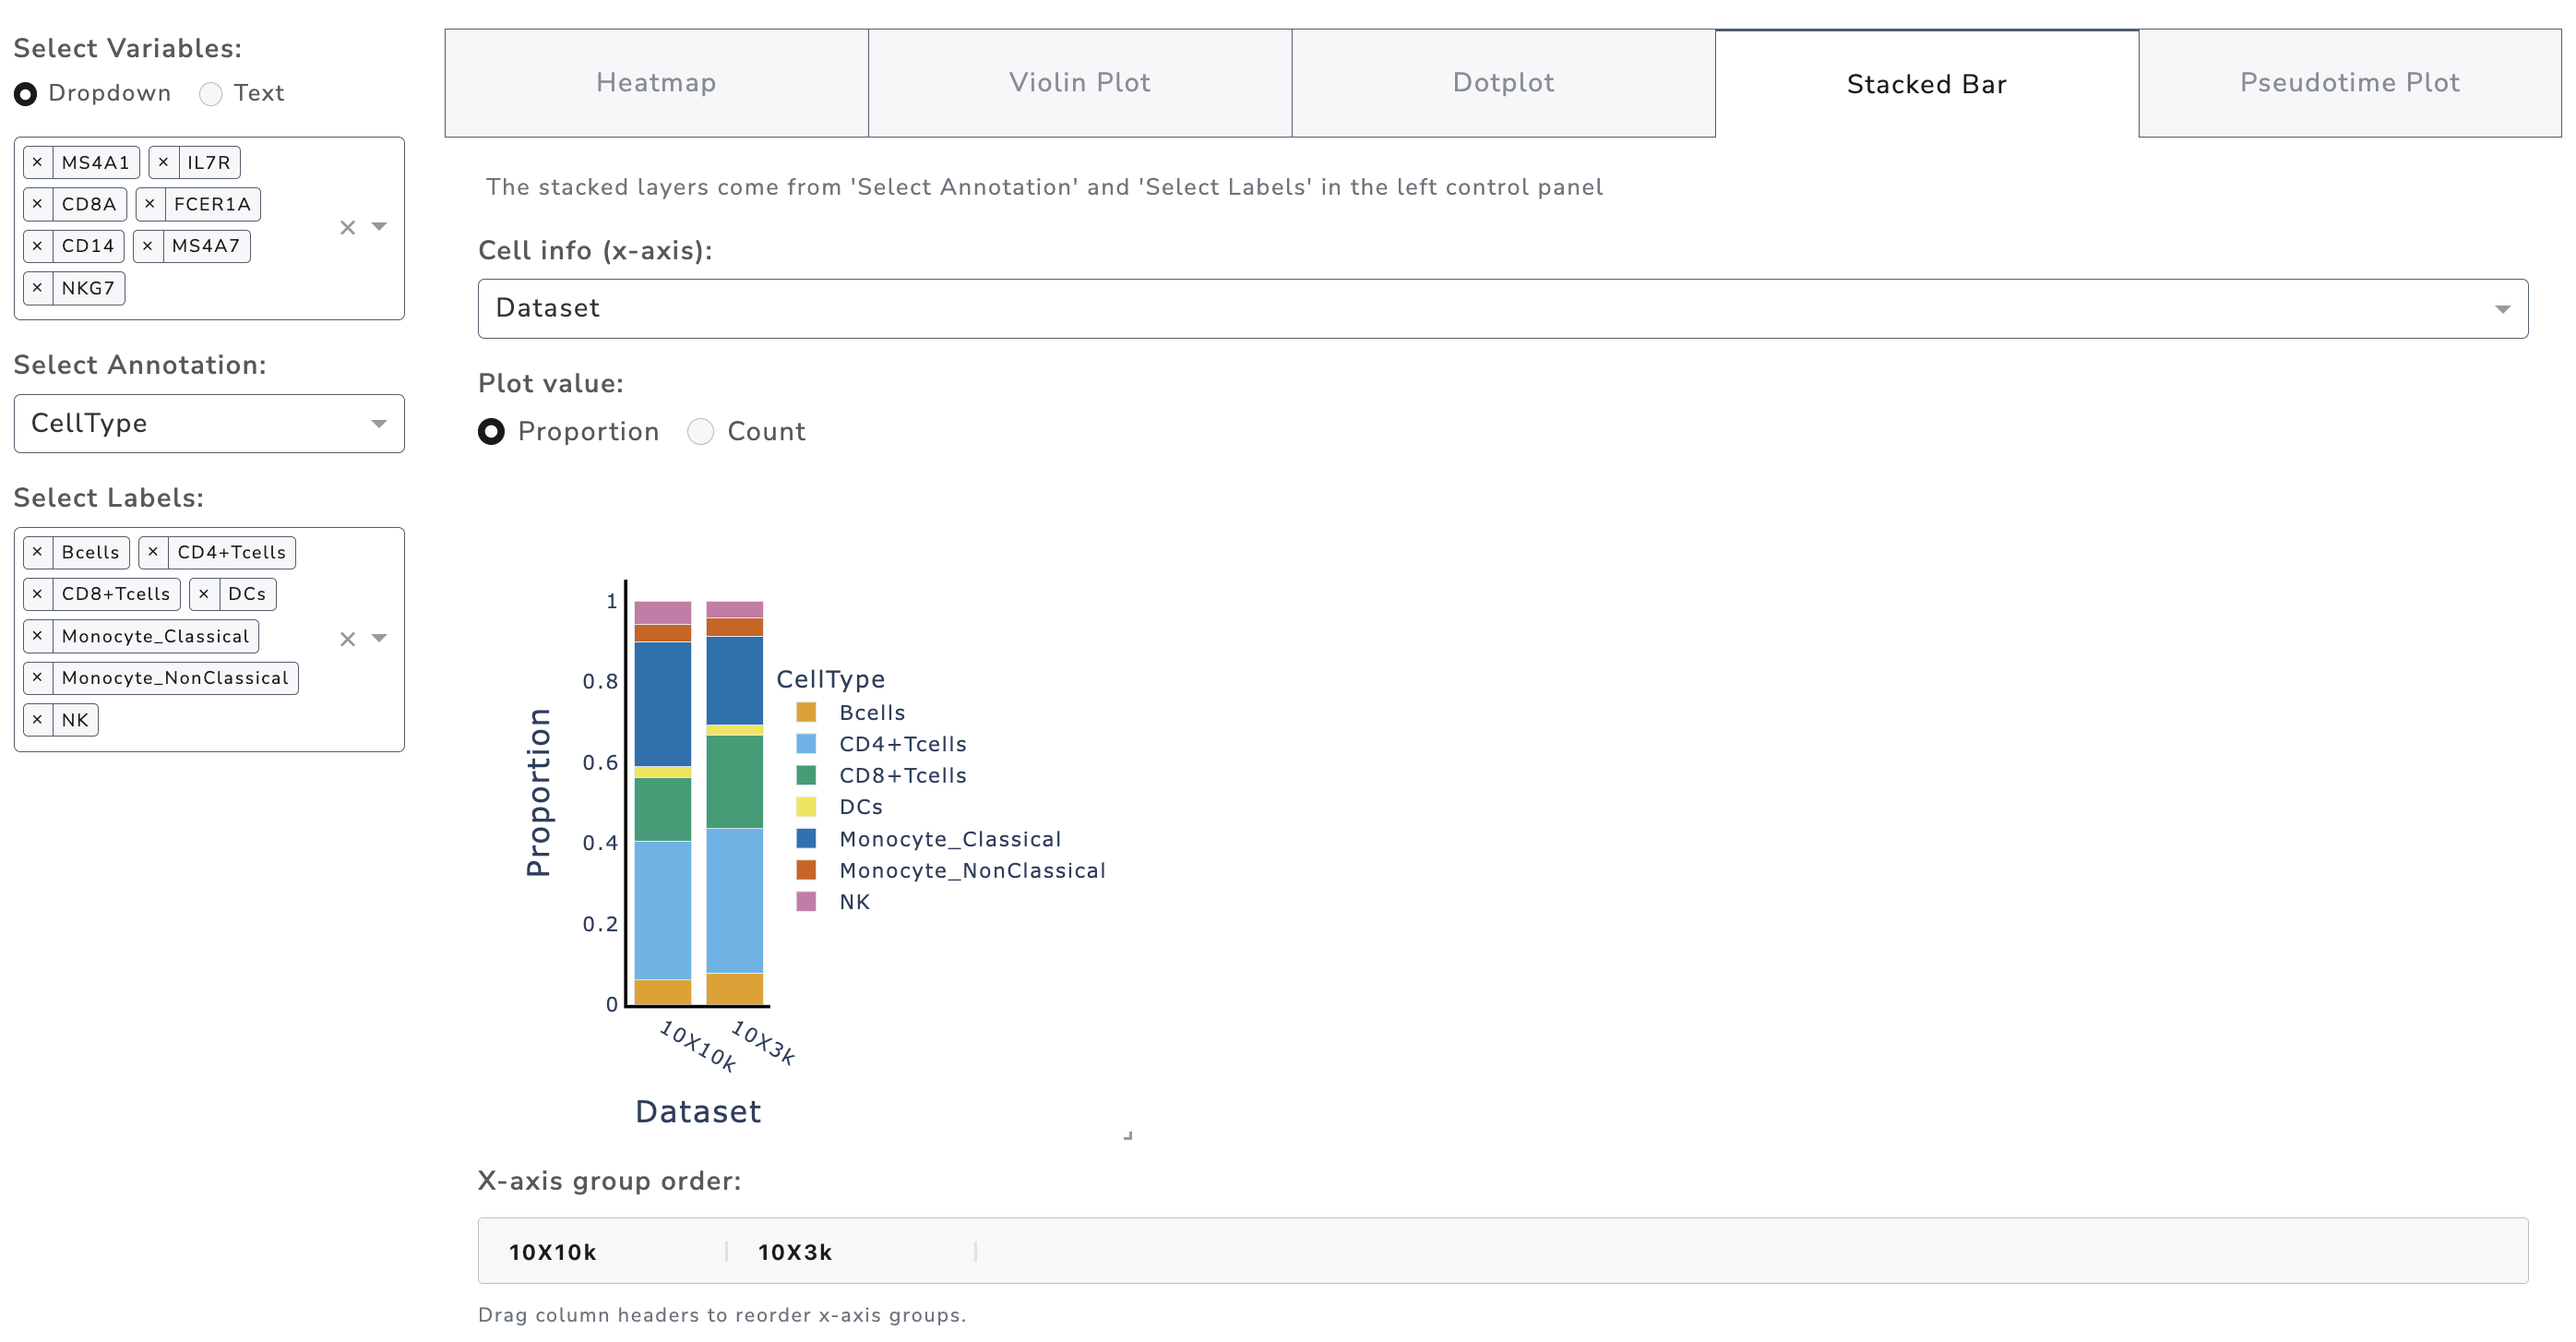
Stacked bar plots illustrate cell composition across groups. Annotation and labels on the left determine stacked layers, while selection within the stacked bar tab defines the x-axis. Users can display proportions or absolute counts. Hovering reveals more details. Groups can be reordered by dragging column headers.
Pseudotime Plot
The Pseudotime Plot visualizes gene expression dynamics along a trajectory (or other continuous metadata). A generalized linear model (GLM) smooth line is fitted to highlight trends.
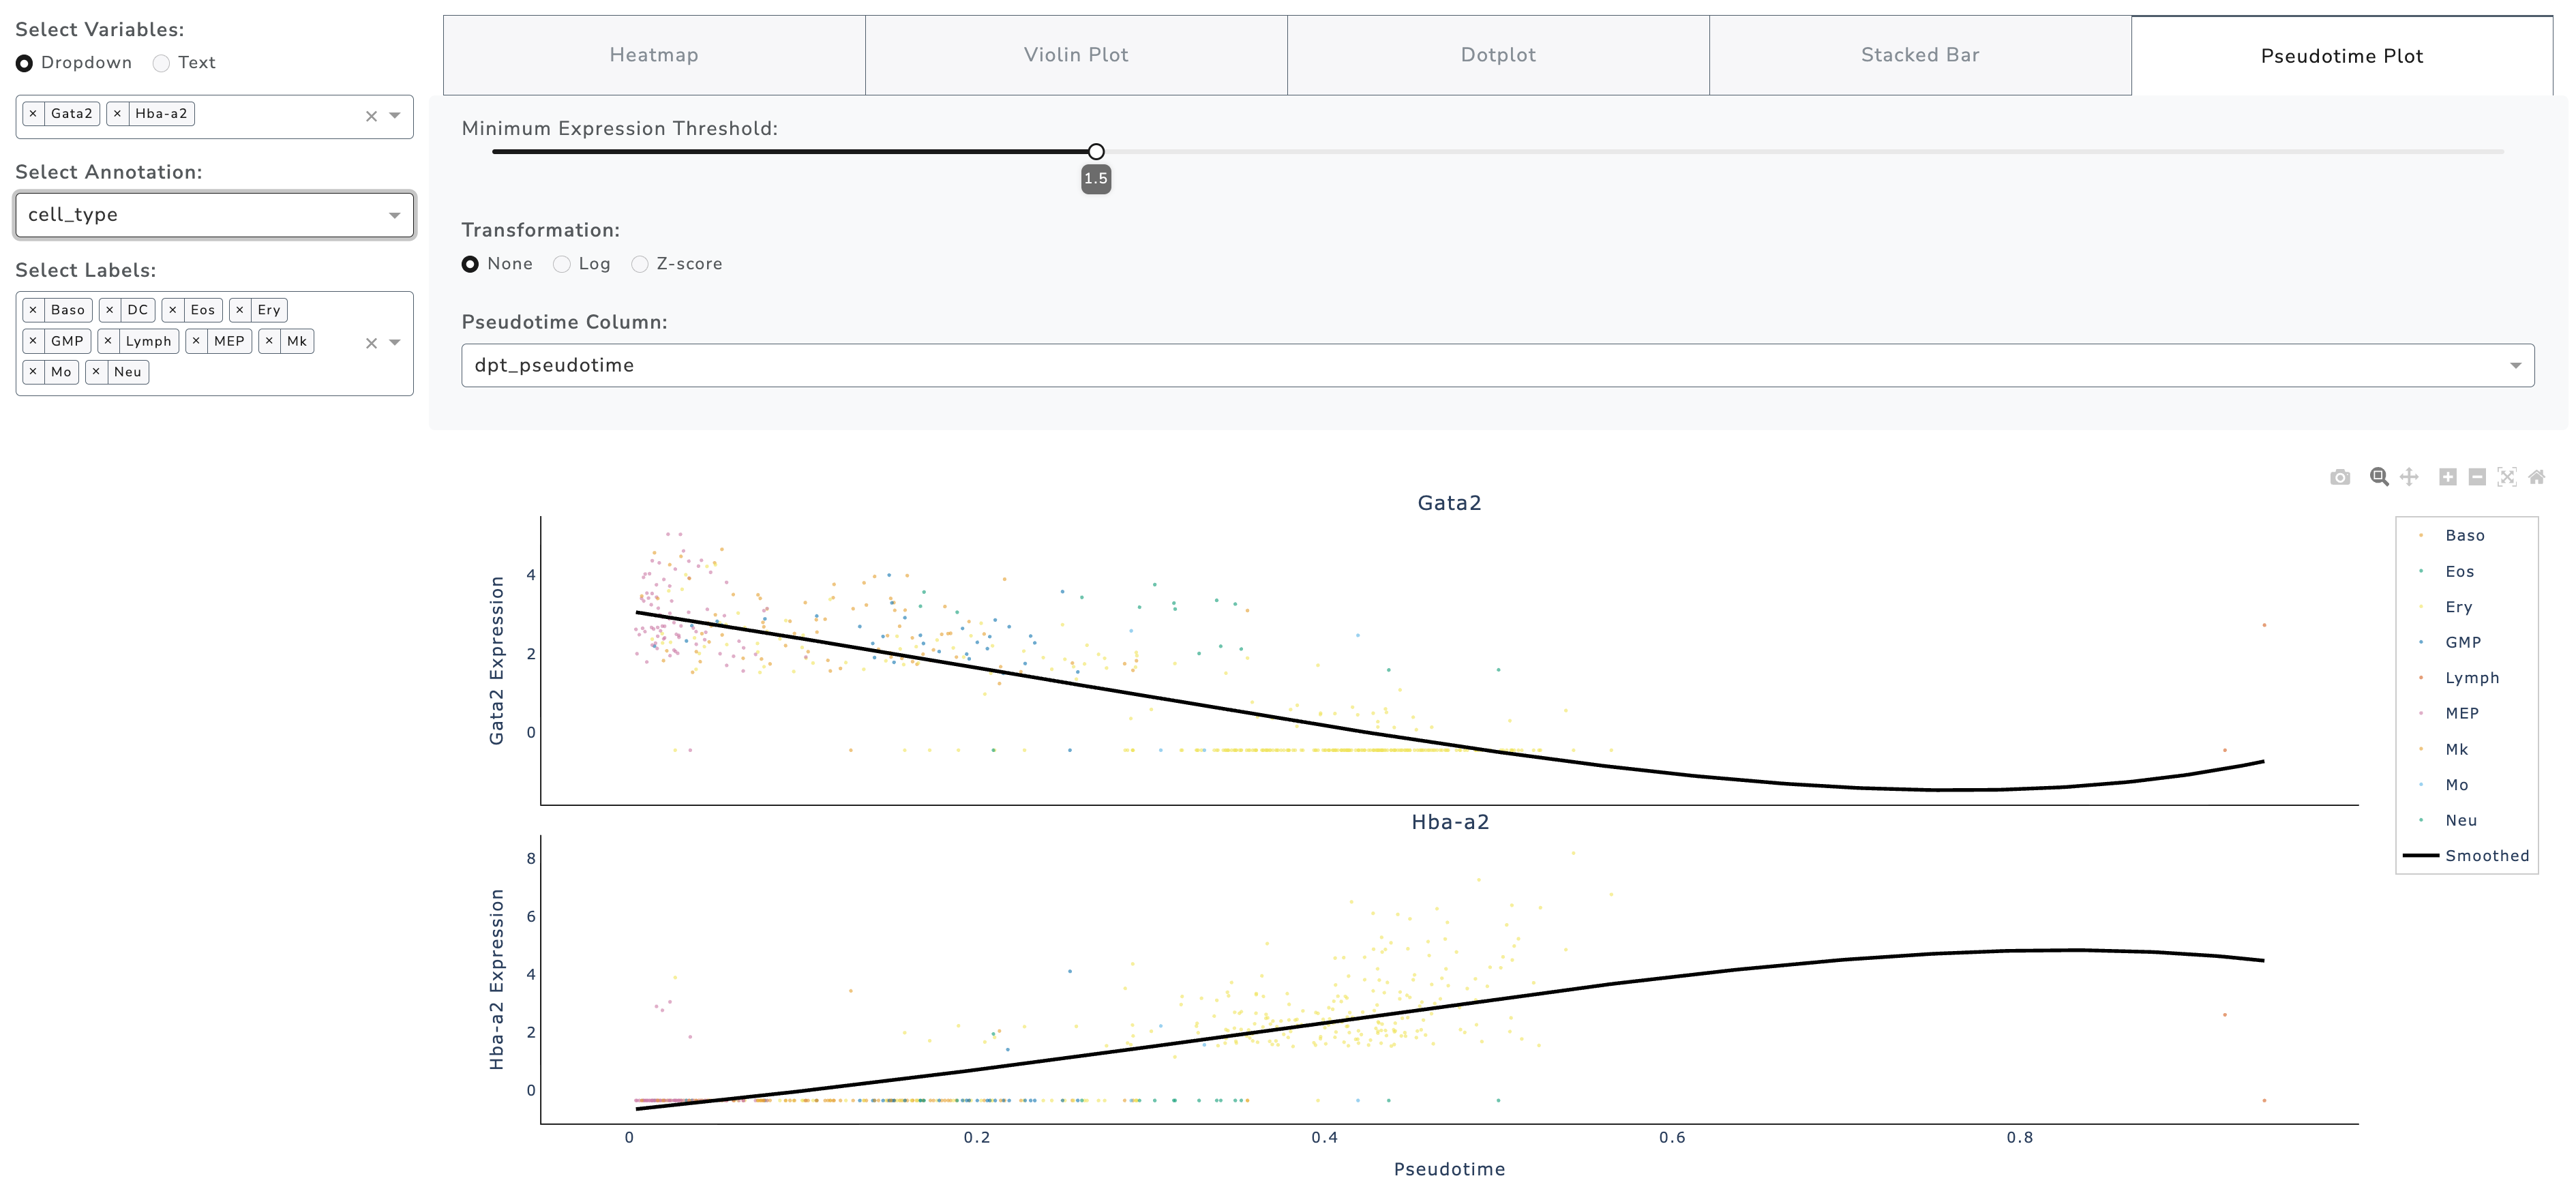
Key Features - Displays gene expression changes along pseudotime - Supports multiple genes in stacked subplots - Fits smoothed regression curves to highlight patterns - Colors points by grouping variable (e.g., cell type or cluster)
Interactive Controls - Filter by minimum expression threshold - Transformation: None, Log, Z-score - Select pseudotime column if multiple are available
Use Cases - Identify genes switching on/off during differentiation - Detect transitional cell state markers - Validate computational trajectory inference - Explore temporal gene regulation
Subset Exploration
Cell Selection
Beyond visualization, GUANACO provides flexible tools for interactively selecting subsets of cells, enabling focused downstream analyses.
Cell selection operates on two layers:
Global Data Filter (categorical metadata) - Controls which cells are displayed in embeddings - Access via Show Filters panel - Select or clear metadata values, then apply
Lasso Selection (embedding plots) - Select cells interactively with the lasso tool - Update other plots (heatmap, violin, etc.) with selected cells
Hierarchy: All Cells → Global Filter → Lasso Selection → Subset in other plots
Notes - Global filter persists until changed - Lasso selections reset when metadata/genes change - If no lasso is applied, “Update Other Plots” passes all filtered cells
Export Selected Subgroup
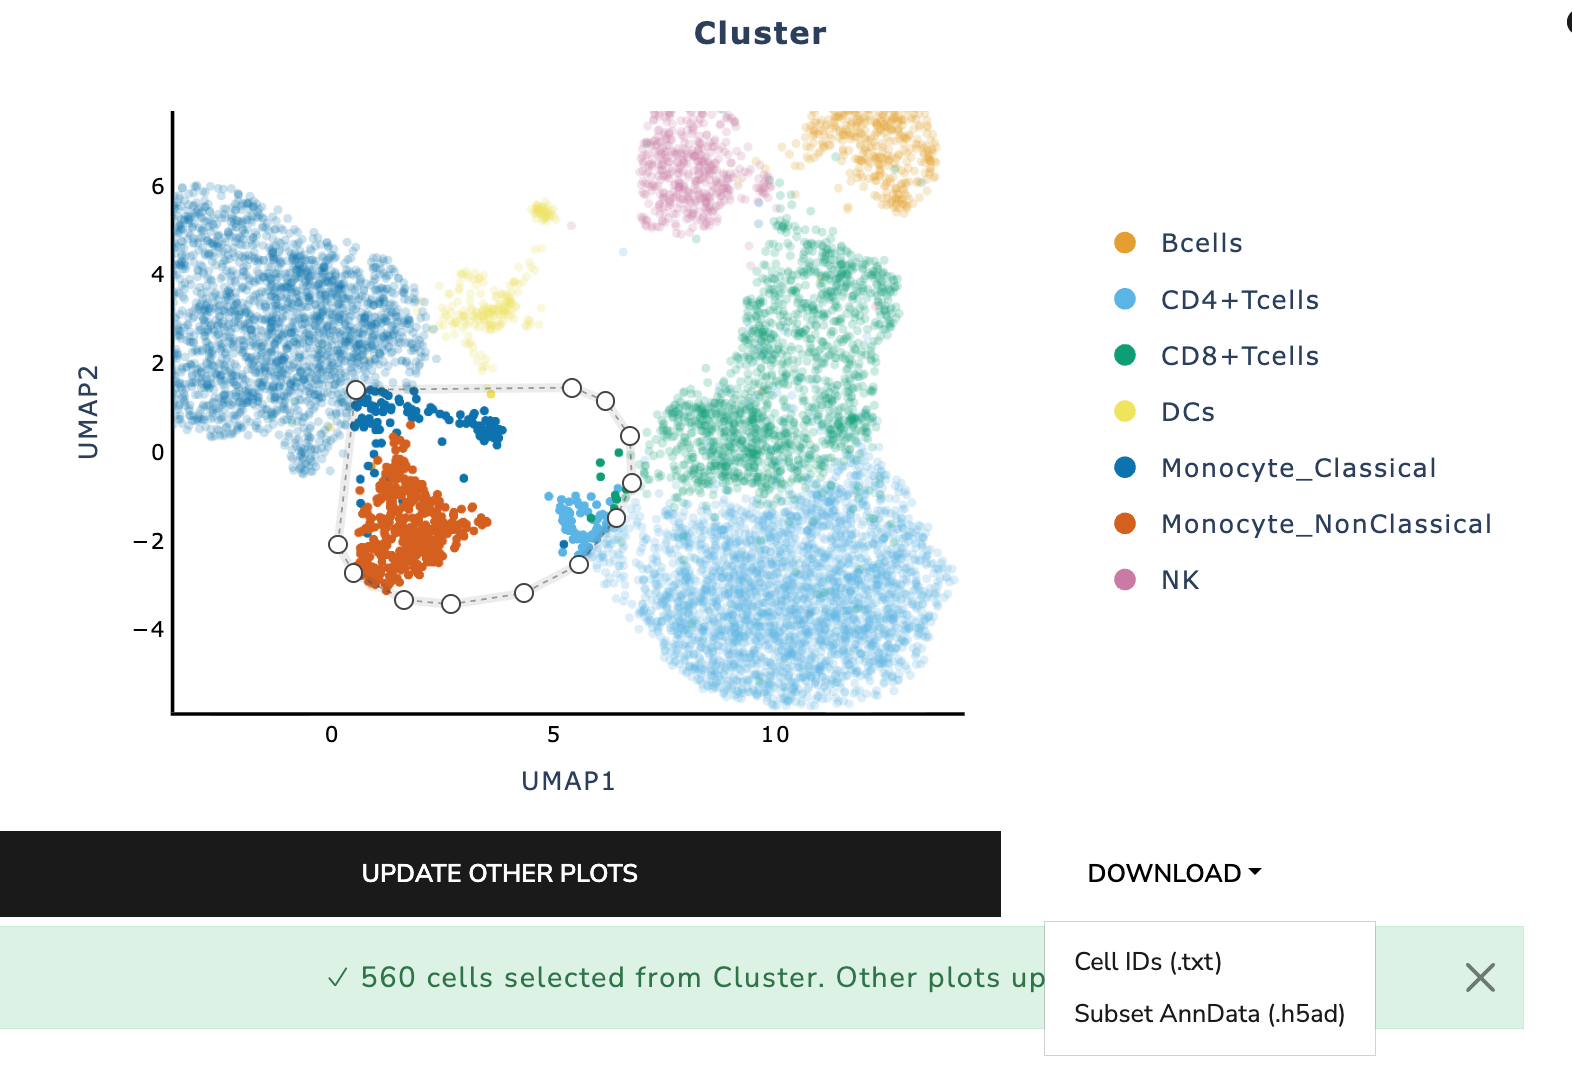
Selected cells can be exported in two formats:
Cell IDs (.txt) - Plain text list of selected cell identifiers - Useful for downstream tools or sharing subsets
Subset AnnData (.h5ad) - Full AnnData object of selected cells - Includes expression, metadata, embeddings, and metrics - Useful for deeper analysis, re-clustering, or sharing complete
subsets
Genome Track Visualization
IGV Browser and Motif Dataset
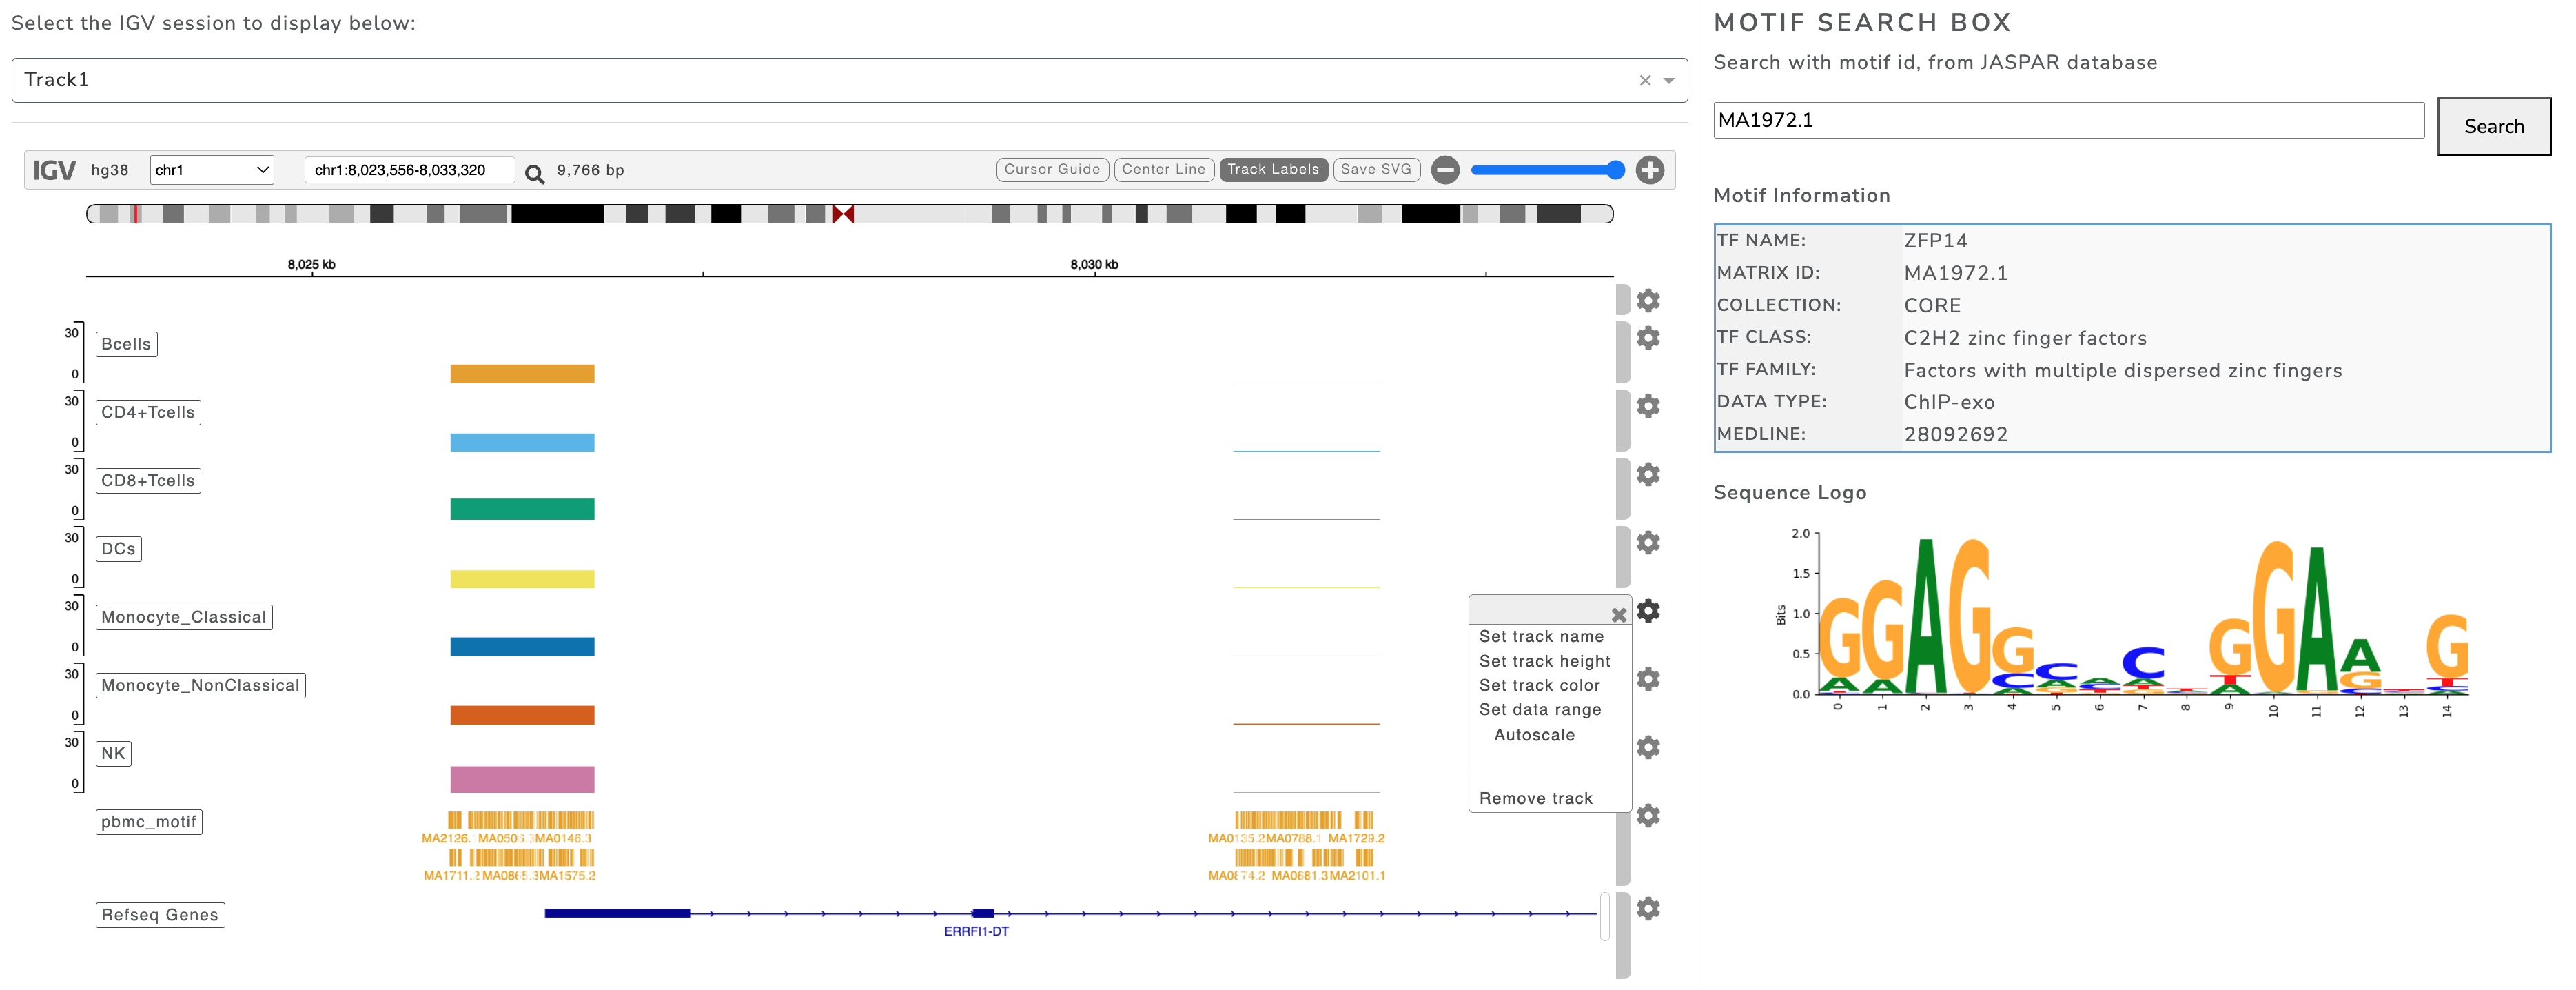
The IGV Browser tab integrates the Integrative Genomics Viewer (IGV) for interactive exploration of genomic regions with multiple tracks (e.g., gene annotations, ATAC-seq peaks, reference sequences). It also includes a motif search tool for transcription factor binding analysis using JASPAR IDs.
Main Components
Session Selector: Choose from multiple predefined tracks separated by metadata
Genome Browser: Navigate, zoom, and explore aligned tracks
Motif Search: Enter JASPAR ID to view motif details and sequence logos
Use Cases - Explore regulatory regions around genes of interest - Compare accessibility across cell types - Analyze transcription factor binding motifs